Blog

Reworking OMR Compiler’s Option Processing Framework

In this blog post, I will talk about the capabilities of the Eclipse OMR Compiler’s option processing framework, its current limitations, and share my experience re-working the options processing framework to address these issues.

The OMR Compiler Options Processing Framework

The OMR Compiler technology’s option processing framework provides a very powerful mechanism to control its run-time behaviour. The options can be specified through the use of environment variables, or as command line arguments when the compiler is being used as part of a runtime. Some of the useful capabilities of option processing include being able to control the level of optimization to apply, what features to enable/disable, specifying the methods to compile and applying certain options to their compilations, etc. These capabilities make the option processing framework a very useful tool for OMR Compiler developers from playing with experimental features to problem determination. To learn more about how to use the OMR Compiler options, you can read more here.

However, there are a number of issues that exist in the current options processing framework that make it difficult for both new and experienced OMR Compiler developers to work with.

Challenges of working with OMR::Options

To demonstrate some of the challenges of working with OMR::Options, I will walk you through the process of adding a new boolean option.

Regardless of whether this option is used within OMR or downstream projects, you will first need to go to omr/compiler/control/OMROptions.hpp and find the TR_CompilationOptions enum definition that looks something like this:

enum TR_CompilationOptions
{
.
.
.
TR_DisableStripMining                  = 0x00040000 + 8,
TR_EnableSharedCacheTiming             = 0x00080000 + 8,
// Available                           = 0x00100000 + 8,
.
.
.
}

The boolean options are stored in a single 32-bit integer field and are set and queried by bitmasking using their values defined in enum TR_CompilationOptions. To add a new option, you need to define it in one of the available slots in the enum definition (eg, 0x00100000 + 8 in the snippet above).

The next step is to add the ability to toggle this option through the command-line, for which you will need to add an entry to the compiler option table defined in omr/compiler/control/OMROptions.cpp.  The option table is sorted alphabetically, so you have to ensure that your new entry does not break the order. Here is how the option table looks like:

// The following options must be placed in alphabetical order for them to work properly
TR::OptionTable OMR::Options::_jitOptions[] = {

   { "abstractTimeGracePeriodInliningAggressiveness=", "O<nnn>Time to maintain full inlining aggressiveness\t",
        TR::Options::setStaticNumeric, (intptrj_t)&OMR::Options::_abstractTimeGracePeriod, 0, "F%d", NOT_IN_SUBSET },
   { "abstractTimeToReduceInliningAggressiveness=", "O<nnn>Time to lower inlining aggressiveness from highest to lowest level\t",
        TR::Options::setStaticNumeric, (intptrj_t)&OMR::Options::_abstractTimeToReduceInliningAggressiveness, 0, "F%d", NOT_IN_SUBSET },
   {"acceptHugeMethods",     "O\tallow processing of really large methods", SET_OPTION_BIT(TR_ProcessHugeMethods), "F" },
.
.
.

The option table in OMROptions.cpp is very large mainly because it has to contain entries that are used in all downstream projects (ie, OpenJ9). This is problematic because if more language runtimes consume OMR, more of these project-specific options would have to be added into this table. It may also result in running out of space in the enum definition to add any new boolean options. The option table has to be in alphabetical order because the command line options are matched to the appropriate entry in the table using a string comparison binary search.

The OMR::Options class is very large, combining all aspects of option processing in one place. As demonstrated above, if someone wanted to add a new option, there is a lot of code to navigate to achieve that. Another limitation developers have to deal with is that there is no standard way to set default values for options, so they have to be set somewhere during the initialization of the options. This doesn’t happen at the same place, so it adds to the difficulty in tracking how the options are set and modified during the lifetime of a compilation or runtime.

Redesign the options processing framework

I spent a lot of time trying to grasp how the option processing mechanism worked and experimented with different approaches to solve the issues discussed in the previous section. My task was to redesign the OMR Options class to address known limitations without removing any existing capabilities or negatively affecting performance.

The final solution involved using a script to process some parts of the options framework at build time. The script, called `options-gen` takes JSON files containing information required to generate data fields for the options as well as table entries required for processing those options when they are specified in the command line arguments.

I’ve split the responsibilities of option processing to different classes, namely:

    • CompilerOptions
    • CompilerOptionsManager
    • OptionsBuilder
    • OptionProcessors

I will now explain the roles of these components and talk about some of the design decisions I’ve made along the way. Hopefully, this will help you get a picture of how they work together and address the issues with the existing Options class.

options-gen

options-gen is a python script that runs at build time and simplifies the management of the option list. The input to this script is a JSON file containing OMR options (and optionally, downstream project-specific options). It introduces a number of new capabilities to option processing such as:

  • removes the need to have any downstream project options within the OMR project
  • simplifies adding new options and removing existing ones
  • provides a mechanism to set default values for options
  • generates a hash table for option look up at build time, reducing the cost of initializing options at start-up

The file containing the list of OMR options is called OMROptions.json. In its current state, it contains downstream project options too. When downstream projects migrate to using the new option processing framework, the project specific options will be moved to Options.json in the downstream projects. This migration will happen over time as we identify what must stay in OMR and what needs to go to their project-specific option list. options-gen combines the data from OMROptions.json and Options.json and processes them together.

Here is how a JSON entry looks like:

{
    "name": "x86UseMFENCE",
    "category": "M",
    "desc": "Enable to use mfence to handle volatile store",
    "option-member": "TR_X86UseMFENCE",
    "type": "bool",
    "default": "false",
    "processing-fn": "setTrue",
    "subsettable": "no"
}
  •  name: The name field is used as an identifier for an option. Every entry should have a unique name. options-gen will warn you if there are duplicate option names. Options provided in the command line and the environment are matched against this field.
  • category: The category field is used to group the options into different categories (eg, codegen, optimization, logging, etc). In this case, “M” stands for miscellaneous options. This information will be used when outputting options help text.
  • desc: Option description text explaining what this option does. It will be used when outputting options help text.
  • option-member: This field is used to identify the field in the options class that stores the value of the option.
  • type: Type of the option data.
  • default: This is the value the option is initialized as, and will remain that way unless changed through the command line, environment variable, or some other logic after options have been processed. For boolean options, the default is false. Numeric and textual data may use this field to set a default value, and will also have the option of using an additional field in the json object to provide as a parameter to the processing function.
  • processing-fn: This is the name of the function in the TR::OptionProcessors class that will be used to process this option if it appears on the command line or environment variable.
  • subsettable: This field is used to set whether an option can be a part of an option subset to apply to specific method compilations.

To add a new option, all you need to do is to add a new entry anywhere in the JSON file and re-build. If the available option processing functions do not meet your requirements, you may define a new function in TR::OptionProcessors and specify its name in the processing-fn field.

options-gen generates the following files at build-time, and are included in different files of the new options processing classes:

  • OptionCharMap.inc: an array of case-insensitive values associated with the characters used in the hashing function to determine the index into the hash table. This array is indexed into using the ascii values.
  • OptionTableProperties.inc: contains macro definitions regarding the option table properties such as min/max hash value, table size, etc
  • OptionTableEntries.inc: contains an aggregate initialization list for the hash table
  • Options.inc: contains the data members of the CompilerOptions class
  • OptionTranslatingSwitch.inc: contains the body of a switch statement that helps translating between the option word masks used in the existing Options class and the corresponding pointer to member of the new CompilerOptions class. This is temporarily in place to enable querying the new options class using the existing getOption(TR_CompilationOptions o) and setOption(TR_CompilationOption o) functions.
  • OptionEnumToStringSwitch.inc: contains the body of a switch statement that translates the existing option masks to strings that can be used for debugging cases of option setting mismatches

The option lookup table

The generated OptionCharMap.inc, OptionTableProperties.inc, and OptionTableEntries.inc files are used for the option lookup table. As discussed earlier, the existing option table design looks something like this:

{ {aa},
  {ab},
  {ad},
  {ba},
  .
  .
  NULL
}

Only option name field (and dummy option names) are used to represent the entries for simplicity. Matching command-line options to the entry would require a binary search on the entire OMR option table as well as the front-end option table if the option was not found in the OMR option table.

Since we already know all the option names at build time, it was a good opportunity to make use of a build time generated hash table. It had to be done by options-gen because not all of OMR’s C++ build compilers supported constant expressions to set this table up at build time. The approach involves options-gen reading the JSON files, calculating hash values using a hashing algorithm, and creating an aggregate initializer list for initializing an array of table entries and writing it to OptionTableEntries.inc. This is how it looks like:

{ {{aa}},
  {{ab},{ba}},
  {},
  {{ad}},
  .
  .
  {}
}

Again, I’ve simplified the entries to make it easier to understand. To get the entry for an option in the command line, OptionsBuilder simply calculates the hash value of the option using the same hashing algorithm used by options-gen to generate the table. The hash value is used to index into the table, obtaining the “bucket”. A bucket can be thought of as a row in the table. The bucket can have multiple entries if there are collisions, so after accessing the bucket, a string compare is required to verify if we got the correct entry and trying the other entries in the bucket if not. With the current set of boolean options in OMR the worst case scenario is 4 entries in a single bucket, so the impact is minimal.

The hash table is not perfect, nor minimal. I’ve spent some time investigating the possibility of generating a perfect hash table so that I could completely eliminate string comparisons when looking up the table. The approach I tried was to mimic gperf‘s perfect hash function generating mechanism. The algorithm I implemented would try to come up with the right combination of associated values for every letter such that no 2 input strings would hash to the same value. This is why the OptionCharMap.inc file is generated, which is used by the C++ hashing algorithm to reach the same hash value for a given option name.

Although options-gen was able to create a perfect hash table, it turned out to be not suitable in this case because the set of option names in OMR were too similar and there were many of them. This resulted in options-gen requiring a long time (about a minute) to come up with the right combination of associated values to have every option hash to a unique value. Another drawback of that approach was that the generated files would not be the same for the same input due to some randomness involved in the algorithm, which may complicate error reproduction and debugging. Furthermore, the hash value range was extremely large, resulting in a very large table. Therefore, I’ve decided to allow collisions in the hash table.

CompilerOptions

The members of the class CompilerOptions are used to store the option data to query from. The list of members of this class is in the generated Options.inc file. Every option gets its own field in this class.

For boolean options, it’s a departure from how it is in the existing implementation, where a single 32-bit integer field is used to store all the option data. The integer field was read and set using bit manipulation using the option flag words as mask. This approach was very space-efficient, but querying the bit settings had more overhead than simply querying boolean fields. To verify that, I’ve implemented a benchmark that queried random options using the 2 different approaches 1 billion times each, and the result was that the boolean field approach was about 3x faster to query and set than the bit manipulation approach. Using boolean fields meant we need slightly more memory to store the boolean options.

OptionProcessors

OptionProcessors is an extensible class that contains the option processing functions. There will be a set of standard processing functions (eg, setTrue, setFalse, setInt32, setStringFromOptionArg, etc) that you may use for processing an option you add to the JSON files. If you would need your option to be processed in a very specific way not handled by existing processors (eg, option affecting multiple members of the option class), you may simply define your own and specify its name in the processing-fn field of the JSON object.

CompilerOptionsManager and OptionsBuilder

CompilerOptionsManager is meant to manage the different aspects of option processing, such as initializing the options, returning the appropriate options for the current method being compiled, etc.

OptionsBuidler’s main role is to parse the command-line string, get the appropriate option table entries, and process the options (and option sets, if applicable).

Current status

I have opened a pull request contributing the main components of the new option processing framework I just discussed in this blog. It only introduces support for boolean options. By using #if/#else pre-processor directives, I set up a transition state where the new options can be used only by explicitly defining the NEW_OPTIONS macro, which can be done by running cmake configure with -DOMR_COMPILER_NEW_OPTIONS=ON. Currently, the new options are initialized with the existing options to make the transition state easier to manage, but eventually this will be managed by the CompilerOptionsManager.

To avoid any potential performance regression, I used an OpenJ9 build that makes use of the new options and ran DayTrader startup and throughput benchmarks on x86-64 Linux, PPC64LE Linux, and Z Linux. The results suggest that initializing and querying the new option processing mechanism did not cause any performance regression, even when for every call of getOption(), there was a comparison done between the results obtained from the existing Options object and the new CompilerOptions object.

What’s next

Over the next few months, I will open a series of pull requests across OMR and OpenJ9 to add the remaining parts of the new options processing framework and eventually completely replace the existing Options class.

Thanks for reading my first Eclipse OMR blog!

About me

I will start the last year of my undergraduate program at the University of Alberta in September this year, majoring in Computing Science with a minor in Mathematics. I was introduced to the Eclipse OMR project in the summer of 2017, when I joined Dr. Sarah Nadi‘s research group at the University of Alberta. As an undergraduate summer research assistant, I was part of the team that started a new IBM CAS research project working on a variability-aware static analysis tool for C++ projects. The goal was to leverage Clang’s static analysis capabilities and introduce a variant handling mechanism so that the tool can analyze multiple build variants simultaneously and report errors in any configuration. Such a tool would help eliminate errors that only manifest themselves in certain build configurations. This project was motivated by the OMR Compiler’s complex variability mechanism making use of -D directives as well varying the -I paths to determine the inheritance hierarchy for its extensible classes implementing a static polymorphism mechanism. A publication we made in late 2017 talks more in detail about the project, and you can read it here.

My work with Clang in the research project got me interested in working with and learning more about compilers, and so the following year I joined the OMR Compiler team in the IBM Toronto Software Lab to satisfy my program’s industrial experience requirement.
A Guide to Double Map Arraylets

What are arraylets?

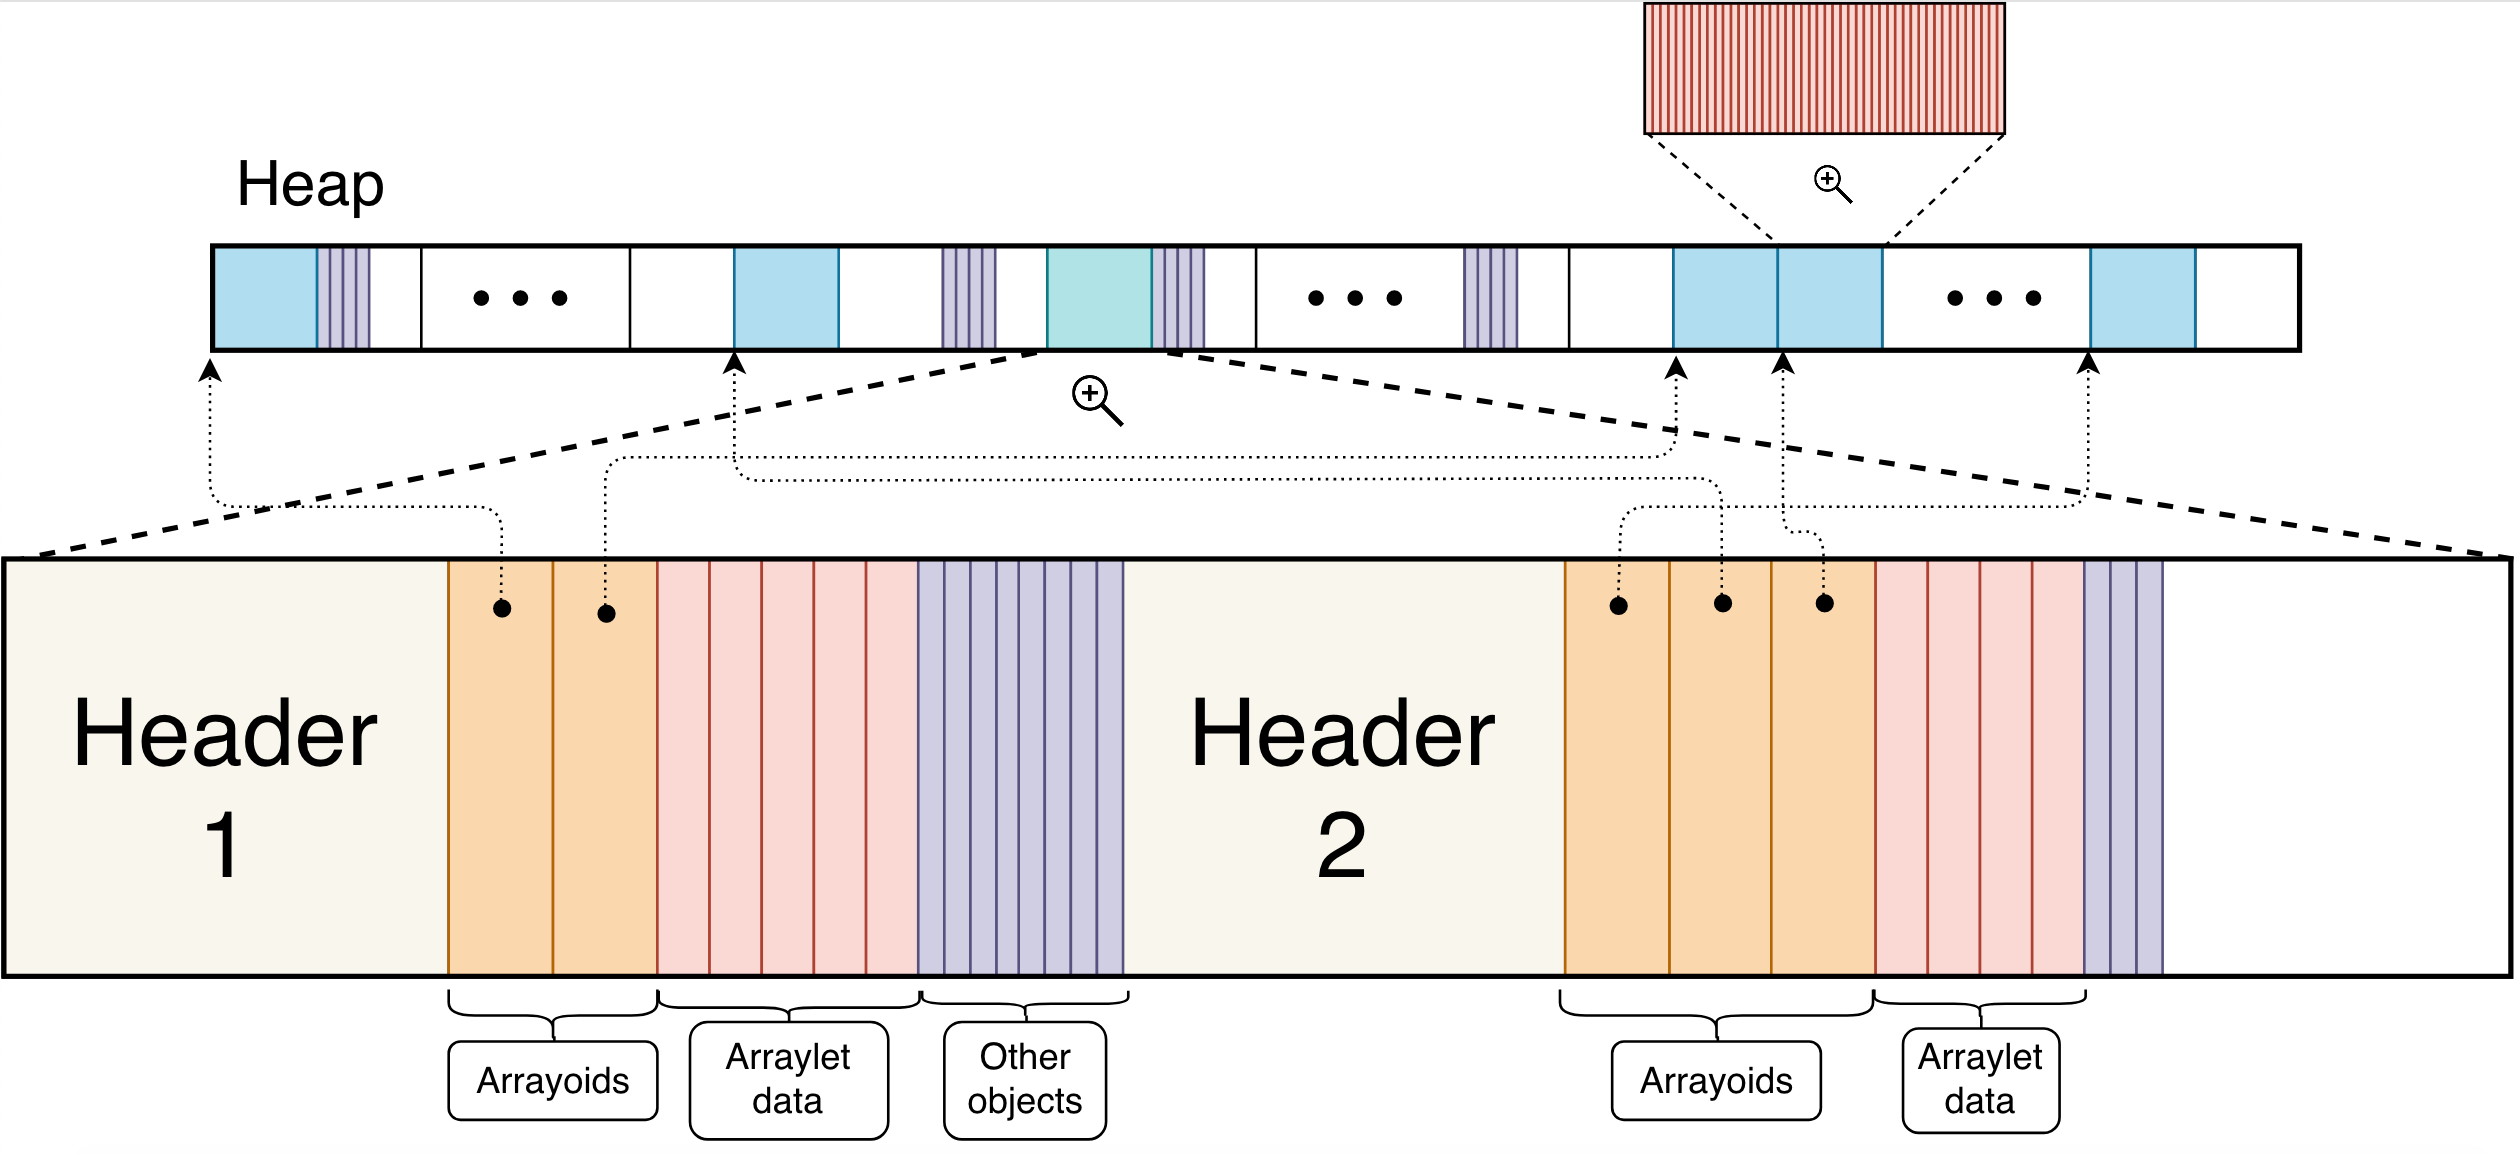
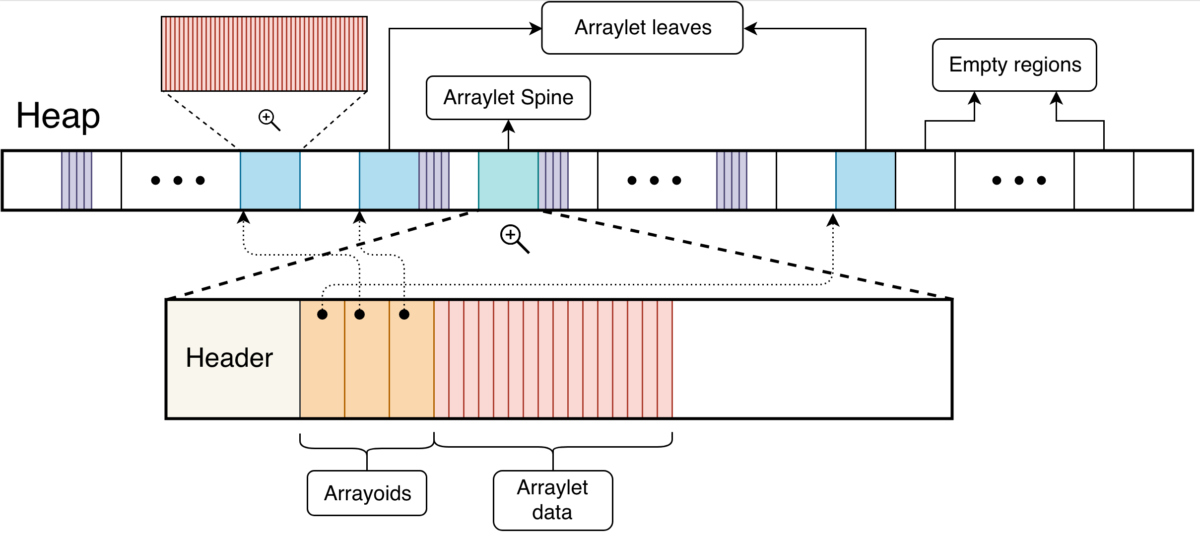
When an array or any object is created in a Java program, one of the places the Garbage Collector (GC) store objects is the heap. Individual objects are stored in a contiguous block of memory, which makes it easier to reference them. Arrays as such are also stored in a contiguous region of memory, where in theory we can access each element of the array given the starting address of the array in memory. However, that’s not the case for GC policies such as metronome and balanced [1][2]. Both these policies are region based, meaning the heap associated with the running program is divided into regions. Objects are allocated inside these regions. Array objects that are smaller than a region will be allocated contiguously, which is the default allocation layout. On the other hand, if the size of an array object surpasses the size of a region, the array is allocated in multiple regions (most likely not adjacent ones), represented as an arraylet (internally contiguous arrays are still stored as arraylets). Arraylets have a spine, which contains the class pointer and size, and leaves which contain the data associated with the array. The spine also contains arrayoids which are pointers to the respective arraylet leaves. Figure 1 explains this layout.

Figure 1: Arraylet Representation (not to scale)

Furthermore, arraylets themselves have different layouts depending on data size. They are contiguous, discontinuous and hybrid. The first layout, represented by the next figure, happens when an array size is sufficiently small to fit in a region. Note that in metronome and balanced policies all arrays are stored as arraylets, even those that fit in its entirety in a region. In this case there are no arrayoids or arraylet leaves, only the header and array data. Figure 2 illustrates two arraylets where both have a contiguous layout.

Figure 2: Arraylet Contiguous Layout

Discontiguous layout depicted in the next figure, happens when all data from the array are stored at the arraylet leaves and no data is stored alongside the spine. Figure 3 illustrates two arraylets where both have a discontinuous layout.

Figure 3: Arraylet Discontiguous Layout

Lastly, hybrid arraylets are a mixture of both contiguous and discontiguous layout, where data is stored both at the leaves as well as in the spine after the arrayoids. Figure 4 illustrates two arraylets where both have an hybrid layout.

Figure 4: Arraylet Hybrid Layout

Note that in all these representations, all arraylet leaves are 100% full of array data. That will change once we introduce double mapping.

Double Mapping

The above representation of arraylets gives the GC flexibility to allocate regions not necessarily adjacent to each other. In this case, to access data in the array, we use arraylet leaf iterators, which hide the complexity of arraylet data access implementation.

Arraylets were introduced so that arrays were more cleverly stored in the heap for balanced and metronome GC policies. However, there are a few drawbacks when using them. One of those is when Java Native Interface (JNI) [3] is used. In short, JNI allows Java programs to call native code (e.g. C, C++) giving more flexibility to the program and functions that it can use. When both large arrays and JNI critical [4] are used, Java programs are experiencing a slowdown.

JNI critical is used when the programmer wants direct addressability of the object. To do that, JNI needs the object to be in a contiguous region of memory, or at least make it think the object is in a contiguous region. For that to happen, JNI critical creates a temporary array on the size of total elements in the original array. It then copies element by element to this temporary array. After the JNI critical is done it copies everything back, again element by element from the temporary array to the arraylet. Yes, that does sound expensive and it is. One use case, SPECjbb2015 benchmark [5] is not being able to finish RT curve building phase when using balanced and the GC policy. This has also become a problem for the JIT (Just in time Compile) when it performs array copy optimizations.

Double mapping arraylets was introduced to solve these problems. The initial idea was to make a large array, which is divided across the heap in different chunks, look like a contiguous array. And that was what we did, but how does it actually work?

For double mapping to happen we leverage something called Operating System Virtualization or virtual memory [7][8]. In a high level, the operating system uses virtual memory to abstract storage in a program. It hides memory fragmentation, where program variables are stored and among other things. Virtual memory also makes the program think it has more physical memory than there actually is available.

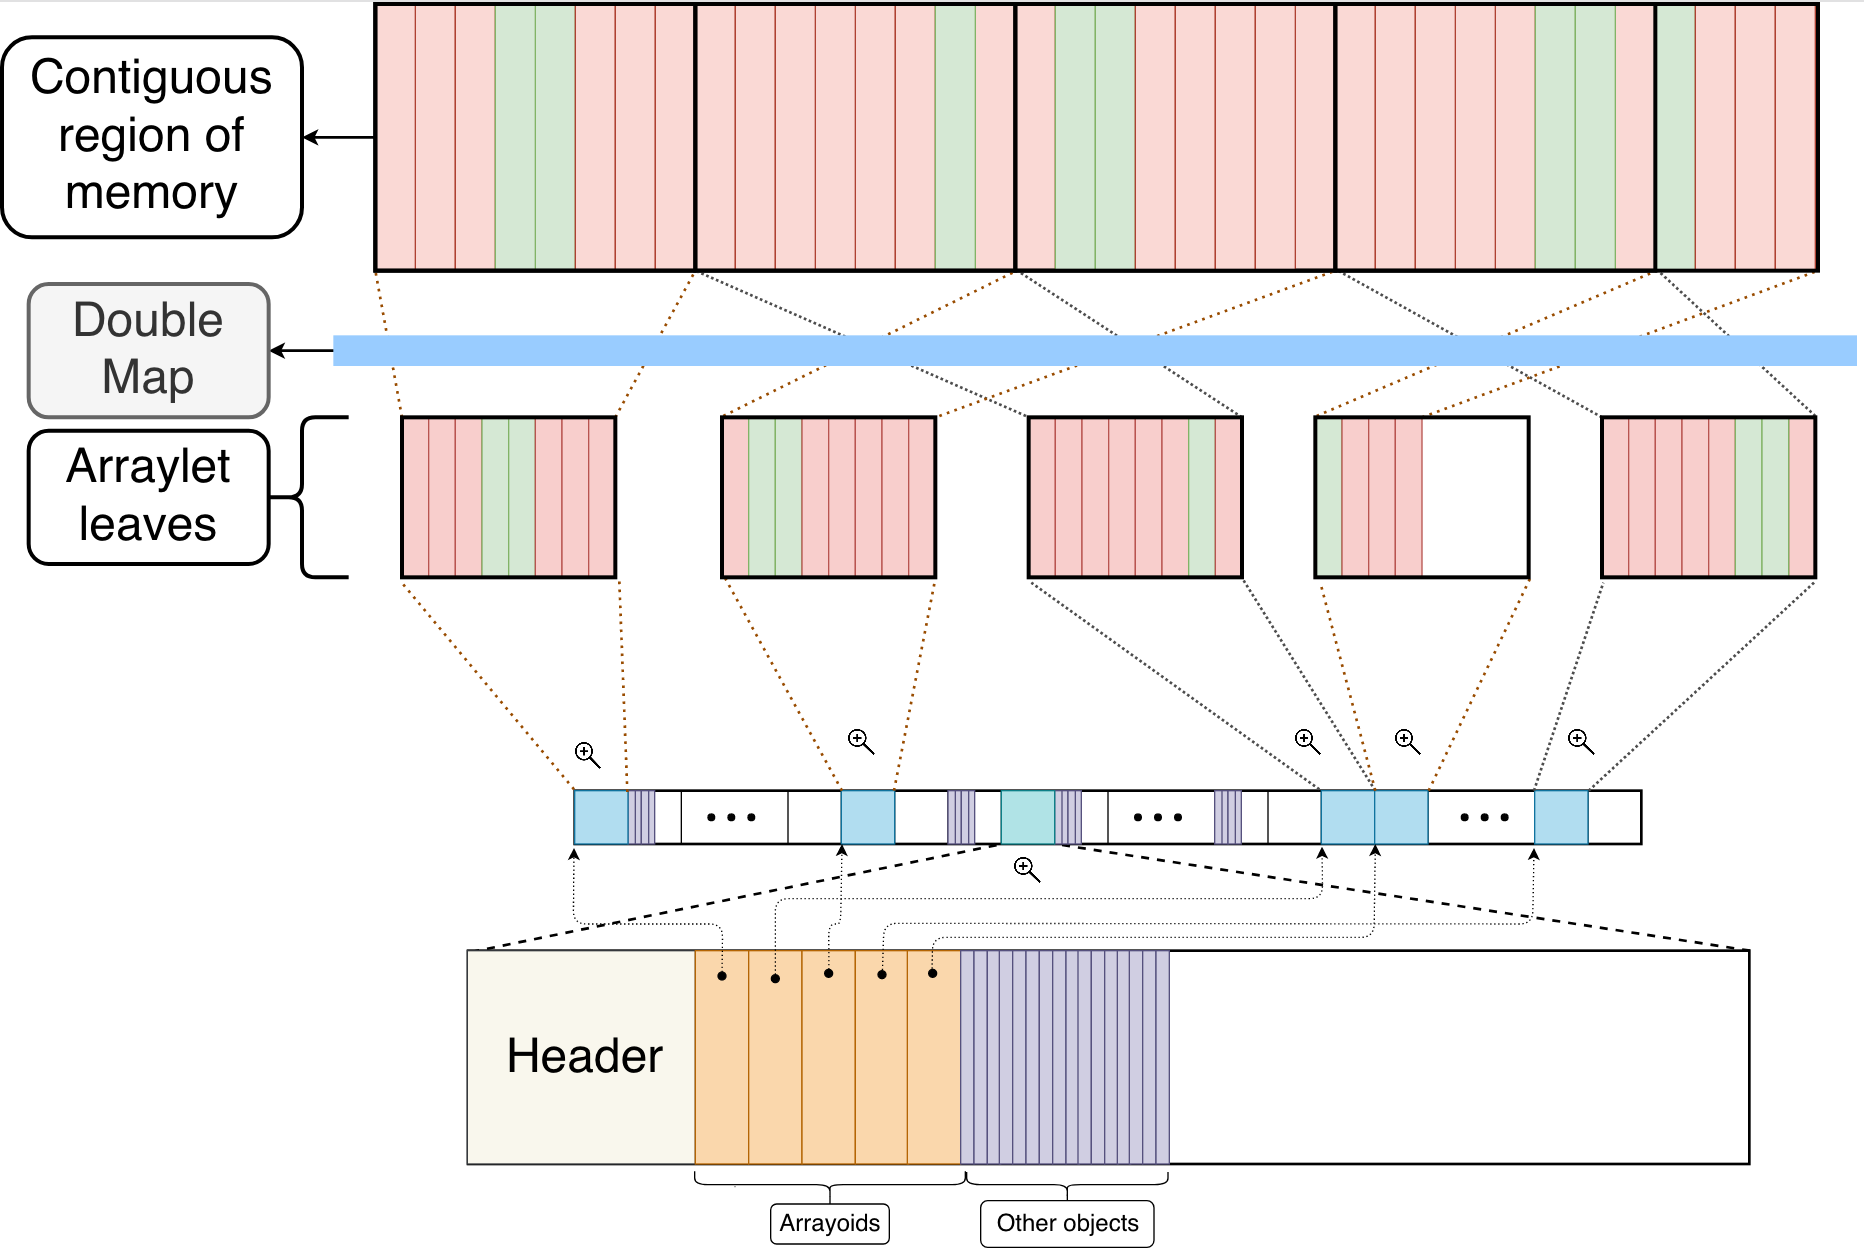
Virtual memory address space on 64-bit systems is very large, 64 bits worth in fact, compared to 32 bits in the 32-bit systems counterpart. However, physical memory is limited to a size much smaller in most cases. Using more virtual memory address space does not really cost the application anything, but using more physical memory would. Therefore, instead of using more physical memory and perform expensive copies, we map two different virtual memory addresses to the same physical memory address. Think of it as a mirror of the original arraylet, where any modification to the newly mapped address will reflect the original array data. The following figure depicts this architecture. Figure 5 captures the main advantage of double mapping explained earlier; we show original data as red rectangles and data being modified as green rectangles. Whenever an element is modified in the contiguous region of memory (green), that is reflected on the physical memory (not shown) which is then reflected in the arraylet leaves that are stored in the heap; hence, no need to copy data over.

Figure 5: Double Mapping Example

With this additional feature to represent arraylets, we no longer make use of the hybrid layout. Whenever the number of elements of an array is not a multiple of a region size, the remainder elements occupy an entire region (arraylet leaf) leaving the remainder space unutilized. Whereas before, every leaf of an arraylet was 100% occupied with array data. Figure 5 shows this behavior where the last araylet leaf is roughly half full. Note that only the part containing arraylet data is double mapped.

Now, whenever JNI or JIT uses arraylets, they won’t need to create and copy element by element to a temporary array. The double mapping is created as soon as the array in the Java program is instantiated. Therefore, JNI and JIT only need to reference the contiguous memory double mapped mirror of the original array. By doing so, it saves a lot of time because the contiguous view of the array which is chucked in its arraylet leaves was already created and only needs to be referenced by JNI and/or JIT.

Prior to implementation, we conducted some experiments to prove our initial concept. These results are demonstrated in the next section. After analysing the results and their effect on the existing code base, we decided to implement approach 1 for the Linux version. We explain why in “Preliminary Experiments and Results” section. Even though Windows does not support calls to mmap, we were able to implement a version for it which follows the same principles as the Linux version.

Linux Experiments

After implementing the Linux version of double map we wrote two simple Java programs to test its performance. One simple program which creates several arrays with different sizes and another program that does the same thing but using JNI critical to do so. Its source code can be found in [6].

We forcibly set the heap size to be 1 GB and the GC policy to balanced in order to analyze if Garbage Collection would suffer from collecting objects constantly. This configuration creates a heap with 2,048 regions, each 512KB in size. Also, for this test we used a double array on the size of 8,484,144, which comprises 129 arraylet leaves in total. After JNI critical, we overwhelm the GC by allocating 2,000 arraylet leaves through several arrays (occupying 2,000 regions). We then iterate over a loop 100 times, where in each iteration it allocates and deallocates 30 arraylet leaves. By the end of the loop we would have created and freed roughly 3,000 regions. We keep the 2,000 arraylet leaves alive throughout the for loop where the GC needs to constantly free regions for upcoming new arraylets.

We ran the program with and without double map and in both cases, the GC was able to collect all necessary objects. This time reported only comprises the time related to the 129 arraylet leaf array. These simple test programs showed that when double map was used, JNI critical performed its operation 26 times faster on average. To be more precise, JNI critical, without double map, took an average of 90 milliseconds to complete; on the other hand, it took 3.5 milliseconds to complete with double map enabled. The above experiments were conducted in an Ubuntu machine with 8 virtual cores, 16 GB of RAM and 2,200.0 MHz of clock speed.

Similar to Linux, we also conducted preliminary Windows experiments which yielded better results when Double Mapping was used. However, we are still on the process of enabling double mapping on Windows platform, but we are confident that they will yield similar results as the preliminary experiments.

Preliminary Experiments and Results

Preliminary experiments shown in this section were performed prior the implementation of this new feature. Two approaches were studied in order to implement such feature. Following is a brief and more technical description of the two.

Approach 1

  1. In order to simulate the GC heap, we used a shm_get call to reserve a shared memory space. After that we call ftruncate to set the desired size to be allocated, say 256MB of memory. Next, we call mmap on the file descriptor returned by shm_getto reserve the memory space , in a random location (first parameter: NULL). Also for the mmap heap call, we pass PROT_READ and PROT_WRITE protection flags so we can write to the heap. Finally, we pass MAP_SHARED as the fourth parameter; note that we cannot use MAP_PRIVATE here, if we do, double map fails. A better way to implement this would be to make the entire heap MAP_PRIVATE, and only share those regions where the arraylets are located. For simplicity we share the entire heap.
  2. Next we simulated arraylets by randomly picking locations in the heap and storing numbers of size of 2 pages. So, if the size of the system page is 4KB we would store 8KB for each arraylet (we can change this size and it does not have to be a multiple of pagesize). At this point we have our representation of the heap along with the arraylets scattered across memory (heap).
  3. On this step we create/reserve a contiguous memory space in order to double map the arraylets. We pre calculate the total size of all arraylets to reserve such space. We used and anonymous mmap with PROT_READ, PROT_WRITE and MAP_PRIVATE flags (since our heap is already shared we can pass MAP_PRIVATE here).
  4. Lastly, we make one call to mmap for each arraylet because one call to mmap would not work for all of them since mmap always allocate a contiguous block of memory. In this approach only one file descriptor is used (different from approach 2) which relates to the heap. For each mmap call we pass in this file descriptor which was created on step 1 as well as each arraylet offset into the heap

Approach 2

  1. Unlike approach 1, in order to simulate the heap we only made a call to mmap without using shm_get. In this case we did not use a file descriptor and instead of passing PROT_READ and PROT_WRITE we passed PROT_NONE to indicate that nothing can be read, written or executed in the heap. We just “reserve” a region of memory so that later we can allocate a proper region for storing data (in this case the arraylets).
  2. To allocate the arraylets we used one file descriptor for each of them. We do so by calling shm_get to then call ftruncate with the size of the arraylet e.g. 8KB; finally, we call mmap with flags PROT_READ, PROT_WRITE, MAP_SHARED and MAP_FIXED because we want to specifically put arraylets in locations (random) in the heap. With this approach only the arraylet space can be read written to, while the rest of the heap stays protected. Furthermore, if there are 500 arraylets we would require 500 file descriptors in this approach. This is a bottleneck because systems have a hard limit on how many file descriptors can be used at a time, e.g. the system we used had a 253 as a limit.
  3. This step is exactly the same as approach 1’s step 3 where we create/reserve a contiguous block of memory to double map the arraylets from the heap.
  4. Lastly, unlike the previous approach where we used the arraylets offset into the heap, in this approach we use each arraylet file descriptor to mmap into the contiguous block of memory created in step 3. Therefore, instead of passing in the heap address to mmap we pass the contiguous block of memory address along with arraylet file descriptors. The end result is the same as before where the double mapping is successful.
Cons approach 1:
  • Associate a file descriptor to the entire heap, as a result we would have to make the entire heap as a large chunk of shared memory.
Cons approach 2:
  • Hard limit of number of file descriptors that can be used at a time

We decided to implement approach 1 for OMR and OpenJ9. If we decided to choose approach 2 there would be a lot of hacks to be done regarding the file descriptor count hard limit.

Source code can be found at: https://github.com/bragaigor/Arraylets

Experiments / Benchmark

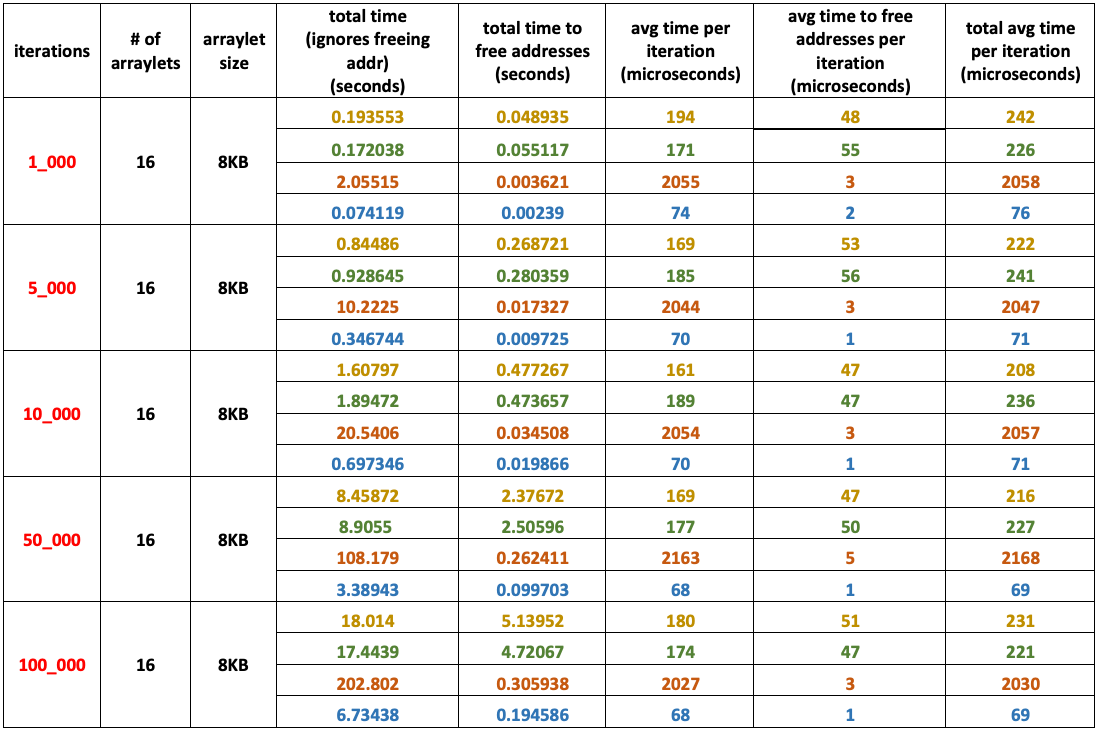
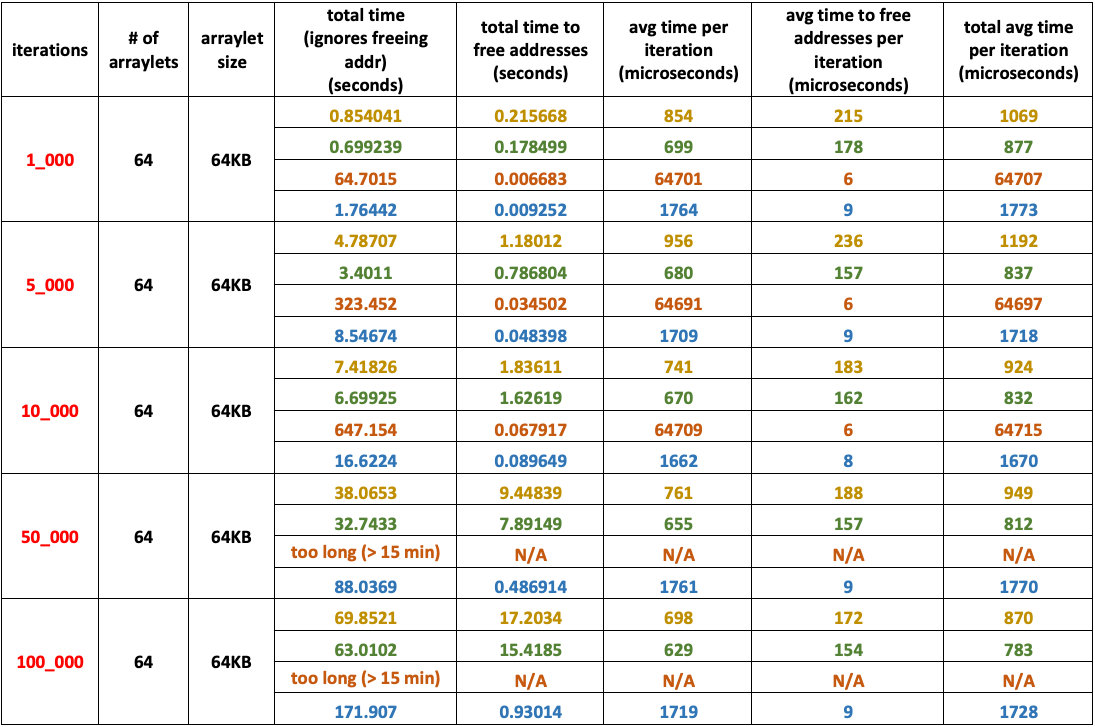
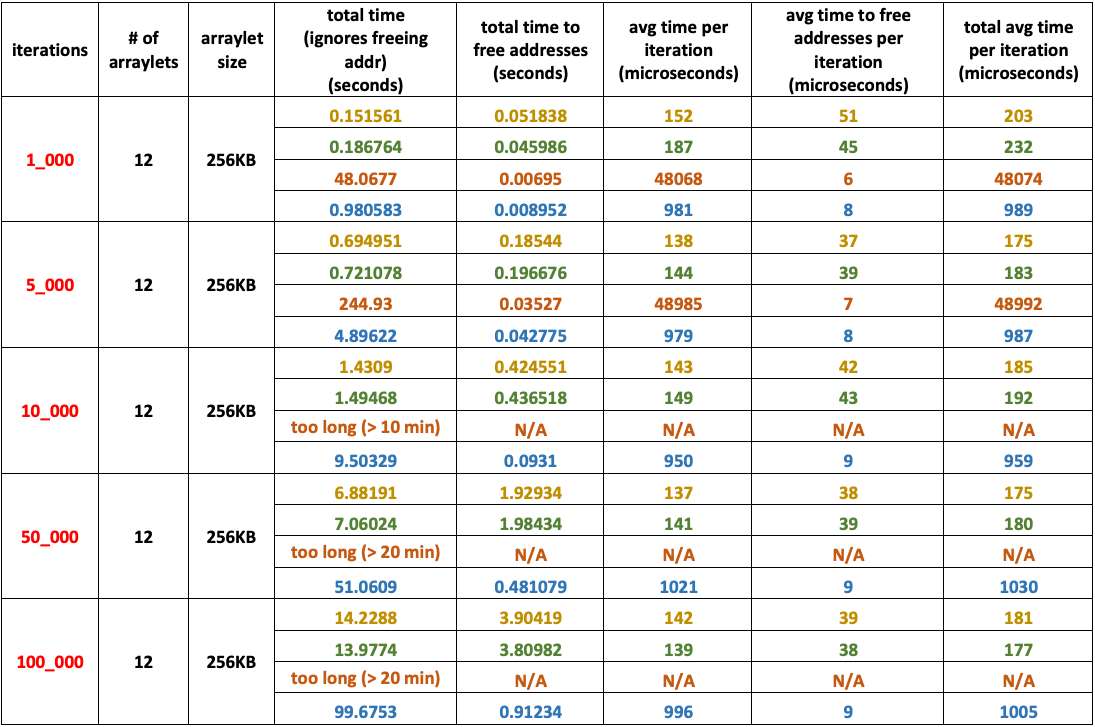
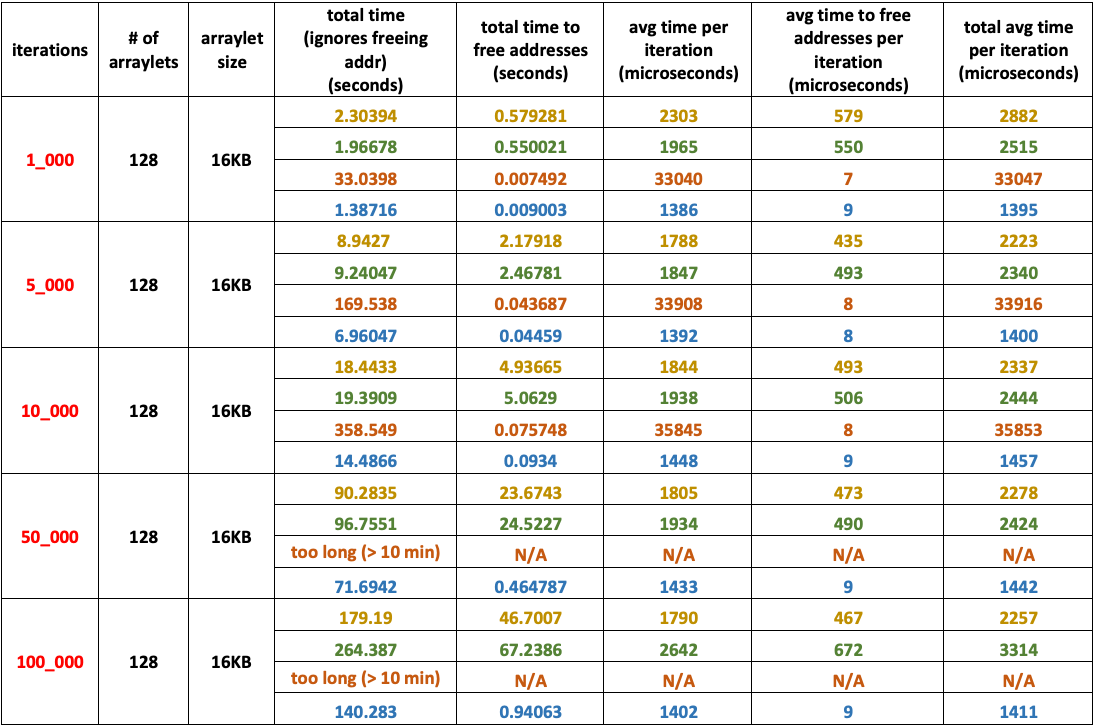
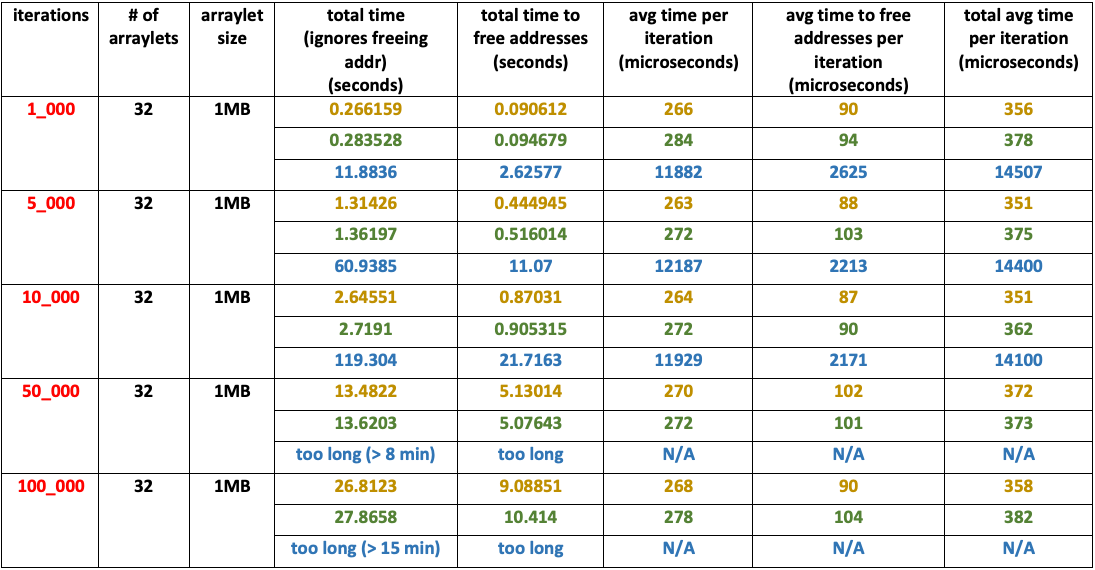
One iteration corresponds to creating/reserving contiguous block of memory, double mapping each arraylet to this chunk of memory and modifying it. The results also include the time taken to free that addresses reserved by shm_get in each iteration.

In case of GC Simulation, an iteration corresponds to copying arraylets into a separate array (index by index or through malloc followed by a memcpy call), modifying this array and then copying its contents back into the original arraylet location in the heap. For tables 1 through 4 both heap simulation does not require malloc because stack is sufficiently large to accommodate all arraylets. However, for consistency we used malloc for tests in the experiment.

Approaches 1 and 2 use munmap to free addresses allocated by shm_get/mmap while heap simulations use free to free memory allocated.

System configuration
  • MacBook Pro (13-inch, Early 2015)
  • Processor: 2.7 GHz Intel Core i5
  • RAM: 8GB
  • Graphics: Intel Iris Graphics 6100 1536 MB


  • Experiments 1 through 4 use heap size of 256 MB
  • Experiment 5 use heap size of 1 GB
  • Experiment 6 use heap size of 4 GB
  • Experiment 7 use heap size of 16 GB
  • Experiment 8 use heap size of 64 GB

Experiment 1

  • Low number of arraylets: – 16
  • Small arraylet size: – – – – 8 KB
  • Heap size: – – – – – – – – 256 MB
  • Arraylets total size: – – – 128 KB

Experiment 1

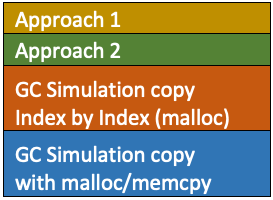
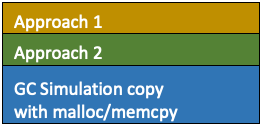
Legend 1

Experiment 2

  • High number of arraylets: – 64
  • Medium arraylet size: – – – 64 KB
  • Heap size: – – – – – – – – – 256 MB
  • Arraylets total size: – – – – – 4 MB

Experiment 2

Experiment 3

  • Low number of arraylets: – 12
  • Large arraylet size: – – – – 256 KB
  • Heap size: – – – – – – – – – 256 MB
  • Arraylets total size: – – – – – 3 MB

Experiment 3

Experiment 4

  • High number of arraylets: – 128
  • Small arraylet size: – – – – – 16 KB
  • Heap size: – – – – – – – – – 256 MB
  • Arraylets total size: – – – – – 2 MB

Experiment 4

Legend 1

Experiment 5

  • Medium number of arraylets: – 32
  • Large arraylet size: – – – – – – – 1 MB
  • Heap size: – – – – – – – – – – – – 1 GB
  • Arraylets total size: – – – – – – 32 MB

Experiment 5

Legend 2

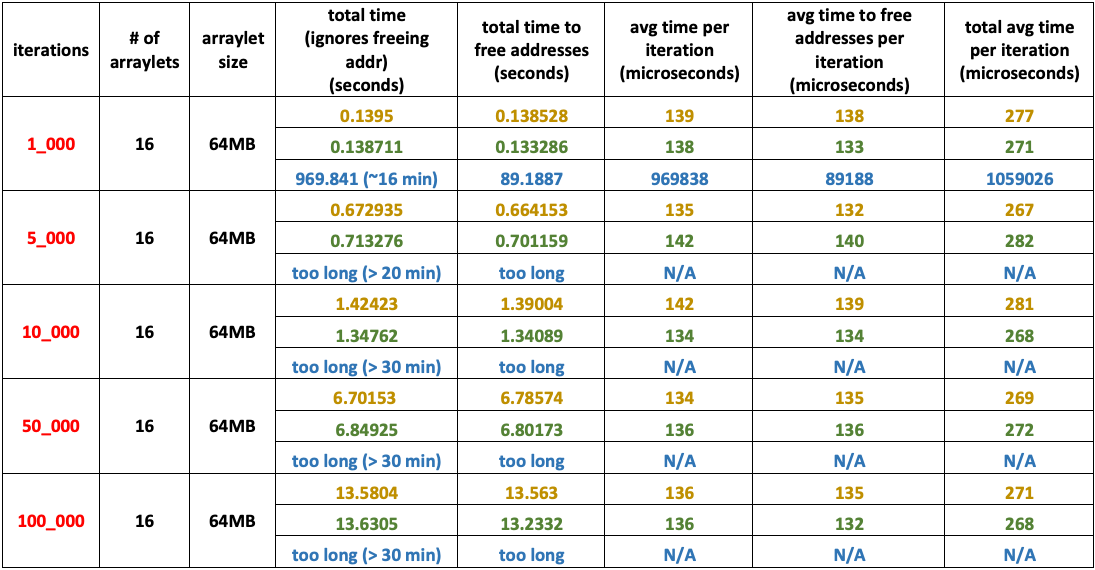
Experiment 6

  • Low number of arraylets: – 16
  • Very Large arraylet size: – – 64 MB
  • Heap size: – – – – – – – – – – – 4 GB
  • Arraylets total size: – – – – – – 1 GB

Experiment 6

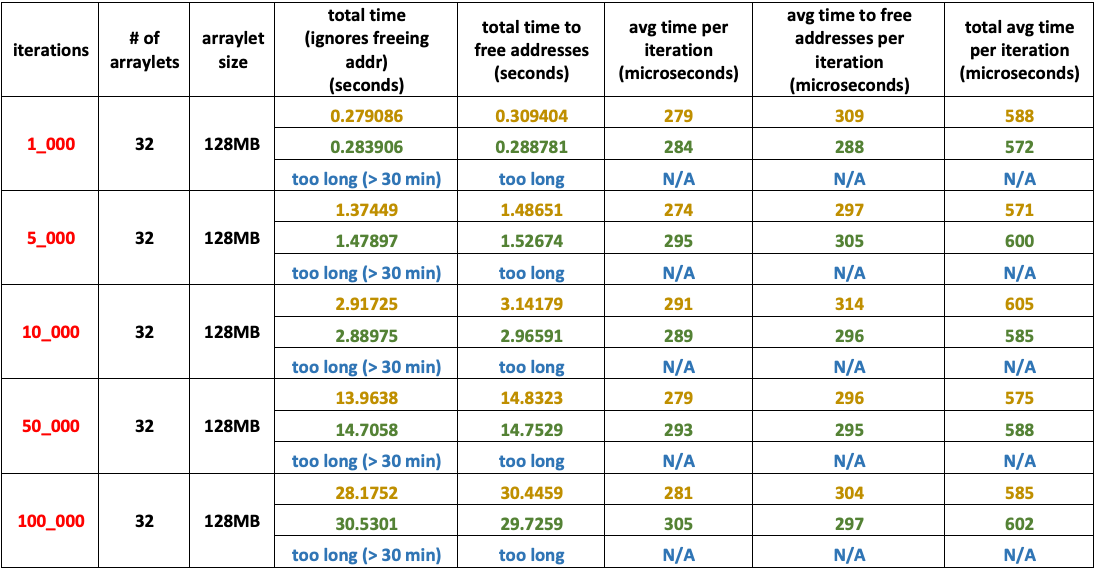
Experiment 7

  • Medium number of arraylets: – 32
  • Very Large arraylet size: – – – 128 MB
  • Heap size: – – – – – – – – – – – – 16 GB
  • Arraylets total size: – – – – – – – 4 GB

Experiment 7

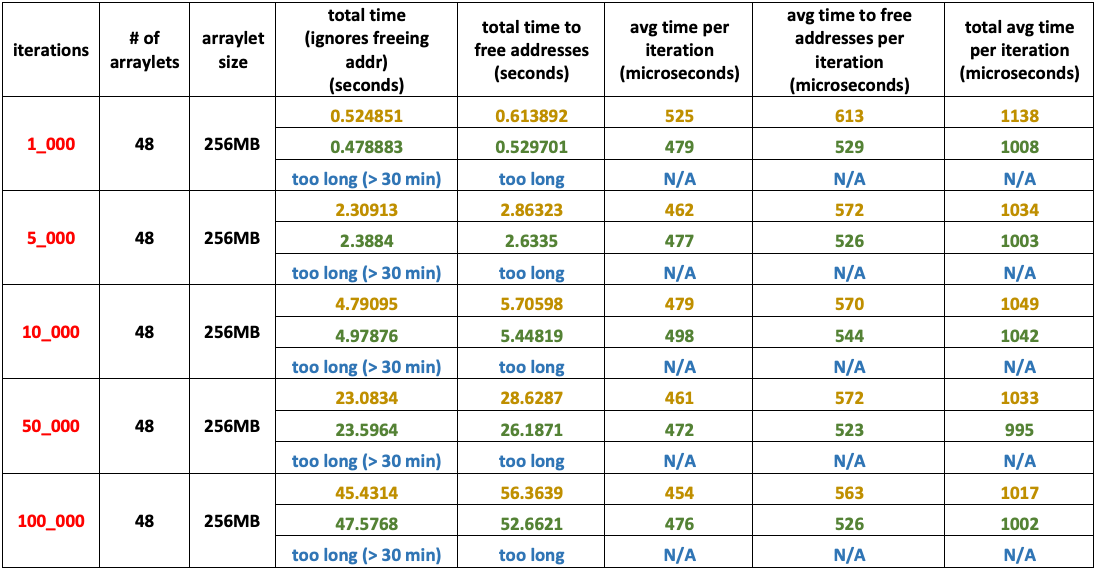
Experiment 8

  • Medium number of arraylets: – 48
  • Very Large arraylet size: – – – 256 MB
  • Heap size: – – – – – – – – – – – – 64 GB
  • Arraylets total size: – – – – – – – 12 GB

Experiment 8

Legend 2


Conclusion and Next Steps

On this post we introduced arraylets, explained what they are and how balanced and metronome GC policies benefit from them. Additionally, we introduced a new feature called double map that improves JNI Critical array access. Experiments showed a considerable improvement when using double map; around 26 times faster than without it to be more precise. Going forward, we will finish Windows implementation and add this feature to Mac OS and AIX as well. Lastly, we will leverage this new feature on JIT, because we believe the JIT can take advantage of double map to optimize array operations.


References

[1] OpenJ9 GC -Xgcpolicy, URL:          https://www.ibm.com/support/knowledgecenter/en/SSYKE2_8.0.0/openj9/xgcpolicy/index.html

[2] Balanced Garbage Collection Policy, URL:            https://www.ibm.com/support/knowledgecenter/en/SSYKE2_8.0.0/com.ibm.java.vm.80.doc/docs/mm_gc_balanced.html

[3] S. Stricker, Java programming with JNI, URL:       https://www.ibm.com/developerworks/java/tutorials/j-jni/j-jni.html

[4] Copying and Pinning, URL:            https://www.ibm.com/support/knowledgecenter/en/SSYKE2_7.0.0/com.ibm.java.lnx.70.doc/diag/understanding/jni_copypin.html

[5] Standard Performance Evaluation Corporation, URL: https://www.spec.org/jbb2015/

[6] Arraylet JNI Java source code, URL: https://github.com/bragaigor/ArrayletTests

[7] What are the differences between virtual memory and physical memory?, URL: https://stackoverflow.com/questions/14347206/what-are-the-differences-between-virtual-memory-and-physical-memory

[8] Virtual Memory, URL: https://www.student.cs.uwaterloo.ca/~cs350/F16/notes/vm-2up.pdf

Investigating the performance of wasmjit-omr, Part 1

Introduction

As a final year university project, a few classmates and I created a JIT compiler for WebAssembly called wasmjit-omr. Our goal was to create a simple JIT compiler capable of accelerating most WebAssembly workloads.

Naturally, we wrote the JIT compiler using Eclipse OMR JitBuilder. A JIT compiler by itself isn’t that useful however, as it usually runs inside a virtual machine (VM). To avoid having to create a full WebAssembly VM, we decided to integrate our JIT in the interpreter that is provided by the WebAssembly Binary Toolkit project, a.k.a. WABT.

After the project ended, we continued to work on it on our own time, with most of the work going towards improving performance.

With a few improvements intended to provide a significant performance boost to wasmjit-omr completed (these will be further discussed in a later post), it became time to validate our assumptions and measure the performance of our JIT.

In this post, the first in a series, I will discuss the process I went through to get an initial insight into the performance improvement our JIT compiler provides over the interpreter. First I will explain how I implemented the benchmark used to measure performance. Then, I will describe some of the tooling I had to implement to run the benchmark; a wasmjit-omr based VM that provides the system calls needed to execute WebAssembly code generated by Emscripten. Finally, I will show and discuss the results of the performance measurements I did.

Creating a Benchmark

The purpose of a JIT compiler is to make programs written in interpreted languages run faster. So, for the initial performance measurements, I focused on measuring the speed up the JIT compiler provides compared to the interpreter alone.

The benchmark I used is a Mandelbrot program because it’s simple, relatively computationally intensive, and frequently used to benchmark language implementations.

To avoid having to write the benchmark in WebAssembly directly (which is doable but unnecessarily tedious), I wrote the Mandelbrot program in C and transpiled it to WebAssembly using Emscripten.

For technical reasons, one property of the wasmjit-omr JIT compiler is that it never compiles the top-level function (main or start function). So, to ensure the JIT compiles the Mandelbrot code, the code must be placed in a separate function. Also, annotating the function with __attribute__((noinline)) prevents Emscripten from inlining it into the main function.

typedef double FP_t;

__attribute__((noinline))
void mandelbrot(int x_pixels, int y_pixels, int* out_table, int max_iterations) {
    FP_t x_scale_factor = 3.5 / (FP_t) x_pixels;
    FP_t y_scale_factor = 2.0 / (FP_t) y_pixels;

    for (int py = 0; py < y_pixels; ++py) {
        for (int px = 0; px < x_pixels; ++px) {
            FP_t x0 = px * x_scale_factor - 2.5;
            FP_t y0 = py * y_scale_factor - 1.0;

            FP_t x = 0.0;
            FP_t y = 0.0;
            int iteration = 0;
            while (x*x + y*y <= 2*2 && iteration < max_iterations) {
                FP_t x_temp = x*x - y*y + x0;
                y = 2*x*y + y0;
                x = x_temp;
                iteration += 1;
            }

            out_table[py*x_pixels + px] = iteration;
        }
    }
}

Since we’re only interested in the time it takes for the Mandelbrot code to execute (and not the VM startup or JIT compilation time), I surrounded a call to mandelbrot() with calls to C’s time() function, which returns the current time in seconds.

int main(void) {
    // ...

    int table[34][80] = {0};
    time_t time_diff = time(NULL);
    mandelbrot(80, 34, (int*)table, 300000);
    time_diff = time(NULL) - time_diff;

    // ..
}

One drawback of using time() is that measurements will only have one-second precision. However, for reasons that I will explain shortly, in this case using time() is a convenient way of measuring time with relatively little effort. Even still, as a first ballpark comparison between interpreted code and JIT compiled code, one-second precision won’t be a problem.

Also, to make sure that the compilation time of mandelbrot() is not measured, I added a dummy call to it before the first call to time(). Because, by default, wasmjit-omr compiles a function just before its first call, using a dummy call ensures compilation has completed by the time the benchmarked code runs.

int main(void) {
    int small_table [3][4] = {0};
    mandelbrot(4, 3, (int*)small_table, 10);

    int table[34][80] = {0};
    time_t time_diff = time(NULL);
    mandelbrot(80, 34, (int*)table, 300000);
    time_diff = time(NULL) - time_diff;

    // ..
}

To report the execution time, we would ideally print it to the screen. However, printing to the screen requires significant support from the VM and would take time to implement.

Instead, I decided to make the execution time the return value of the main() function. Given that the time is in seconds, the range of the return value should be just enough to get meaningful results from the benchmark.

int main(void) {
    // force JIT compilation
    int small_table [3][4] = {0};
    mandelbrot(4, 3, (int*)small_table, 10);

    // run and time the benchmark
    int table[34][80] = {0};
    time_t time_diff = time(NULL);
    mandelbrot(80, 34, (int*)table, 300000);
    time_diff = time(NULL) - time_diff;

    return time_diff;
}

The complete code for this benchmark and build instructions can be seen here: https://github.com/wasmjit-omr/micro-benchmarks/tree/post1.

Dealing with System Calls

In most systems, tasks such as getting the current time and printing text to the screen are generally done via system calls; special calls that are handled by the operating system. Most programming languages hide this behind more convenient interfaces like standard libraries. However, the implementation of these eventually relies on making a system call.

WebAssembly does not support making system calls directly. Instead, it allows VMs to provide “host functions” that are callable from WebAssembly code. Compilers like Emscripten take advantage of this by emitting “host calls” where a regular C compiler would have emitted a system call.

By design, the only system call that is required to run the Mandelbrot benchmark is _time, which is used by the time() function. Other unused/uncalled host imports are removed by Emscripten when using the -O3 flag ( -Os also does this).

Implementing the System Calls

By default, the WABT interpreter does not provide any host functions. Since WABT is designed to be embedded, it is the embedder’s responsibility to define the host functions and other imports they want to expose to WebAssembly code. WABT’s wasm-interp tool shows an example of how this is done.

To execute the Mandelbrot benchmark with wasmjit-omr, a custom tool (or “embedder”) that provides the host functions that handle system calls was needed. I decided to call this tool em-interp (the em- is for EMscripten).

To implement this tool, I started by just copying the wabt-interp source code, which is just one file.

Next, I created a function that takes a pointer to a wabt::Environment object and that registers a new module in it.

void AppendEmscriptenModule(wabt::interp::Environment* env);

The new function is called from the environment initialization routine. Creating a separate function decouples the definition and implementation of the host module (its functions, memories, tables, constants, etc.) from the core tool implementation.

static void InitEnvironment(Environment* env) {
  AppendEmscriptenModule(env);
  // ...
}

WebAssembly code generated by Emscripten imports system calls from a host module called env. env is also used to import other components like linear memory, tables, and a few constants initialized by the host VM. In addition to the _time system call, the Mandelbrot code only needs a linear memory. As such, these are the only components that I implemented in AppendEnvrionmentModule.

void AppendEmscriptenModule(Environment* env) {
  HostModule* module = env->AppendHostModule("env");

  Memory* memory = nullptr;
  Index memIndex = 0;
  std::tie(memory, memIndex) = module->AppendMemoryExport("memory", Limits{256, 256});

The function first creates a host module called env and adds to it a linear memory with the appropriate size limits.

module->on_unknown_func_export=
      [](Environment* env, HostModule* host_module, string_view name, Index sig_index) -> Index {
          printf("Importing unimplemented host function '%s' from '%s' module\n", name.to_string().c_str(), host_module->name.c_str());
          auto name_s = name.to_string(); // cached copy of name to avoid reading bad values from string_view
          auto callback = host_module->AppendFuncExport(
                  name,
                  sig_index,
                  [=](const HostFunc* func, const FuncSignature* sig, const TypedValues& args, TypedValues& results) -> interp::Result {
                      printf("Call to unimplemented host function '%s' from '%s' module!!!\n", name_s.c_str(), host_module->name.c_str());
                      return interp::Result::TrapUnreachable;
                  });
          return callback.second;
      };

The next part of the function may be a bit confusing (a lambda within a lambda, whaaaat?) but what it does is fairly straightforward. If a WebAssembly module attempts to import a function from env that isn’t provided, this code will instead provide a “dummy” function that will immediately trap. That way, as long as the unimplemented function is never called, the WebAssembly code will work correctly without having to provide all it’s imported functions.

  module->AppendFuncExport("_time"
                          ,{{Type::I32}, {Type::I32}}
                          ,[=](const HostFunc* func, const FuncSignature* sig, const TypedValues& args, TypedValues& results) -> interp::Result {
                             auto t = static_cast<uint32_t>(time(nullptr));
                             auto addr = args.at(0).get_i32();
                             if (addr != 0) {
                                memcpy(memory->data.data() + addr, &t, sizeof(uint32_t));
                             }
                             results.at(0).set_i32(t);
                             return interp::Result::Ok;
                          });
}

Finally, the _time system call is created and made available as a host import. The host function to be invoked is defined inline using a lambda. The VM (interpreter and JIT) takes care of performing the transition from WebAssembly code to the host function when the latter is invoked.

The complete code for em-interp can be seen here: https://github.com/wasmjit-omr/em-interp/tree/initial.

Benchmark and Results

With the benchmark written and the system calls setup, all that was left was to run the benchmark.

My primary goal was to compare the performance of interpreted code vs. JIT compiled code. So first, I ran the Mandelbrot program with the --disable-jit option, which (as the name suggests) disables the JIT and forces the program to be interpreted. I then did the same thing again but without the --disable-jit option so that the benchmark code would be JIT compiled.

$ ./em-interp ../../micro-benchmarks/mandelbrot.wasm --disable-jit
_main() => i32:110
$ ./em-interp ../../micro-benchmarks/mandelbrot.wasm
_main() => i32:1

Right away, it was pretty evident that the JIT provides a significant performance boost. JIT compiled code was roughly two orders of magnitude faster than interpreted code!

To make things a little more scientific I did the comparison 10 more times. These were the results:

Interpreter (s) JIT (s)
110 1
111 1
110 1
110 0
111 0
111 1
112 1
110 1
111 0
110 1

I did not do a particularly detailed analysis of the results because only having one-second precision makes it difficult to draw any reasonable conclusions from the data. For example, the zeros in the “JIT” column don’t mean that the JIT compiled code took zero seconds to execute, just that it took less than one second to execute (probably). The only thing we can say is that JIT compiled code was roughly two orders of magnitude faster than interpreted code, which is pretty cool!

Conclusion

In this blog post, I described some work I did for measuring and comparing the performance of JIT compiled code vs interpreted code in wasmjit-omr.

I first had to create a Mandelbrot program in C that I then compiled to WebAssembly using Emscripten. I then created a tool based on wasmjit-omr that can run code generated by Emscripten. Finally, I ran the benchmark using this tool and found the JIT compiled code was roughly two orders of magnitude faster than interpreted code.

In the next blog post, I will discuss further performance measurements and comparison with higher precision and a closer look at what contributes to the improved performance.