What are arraylets?
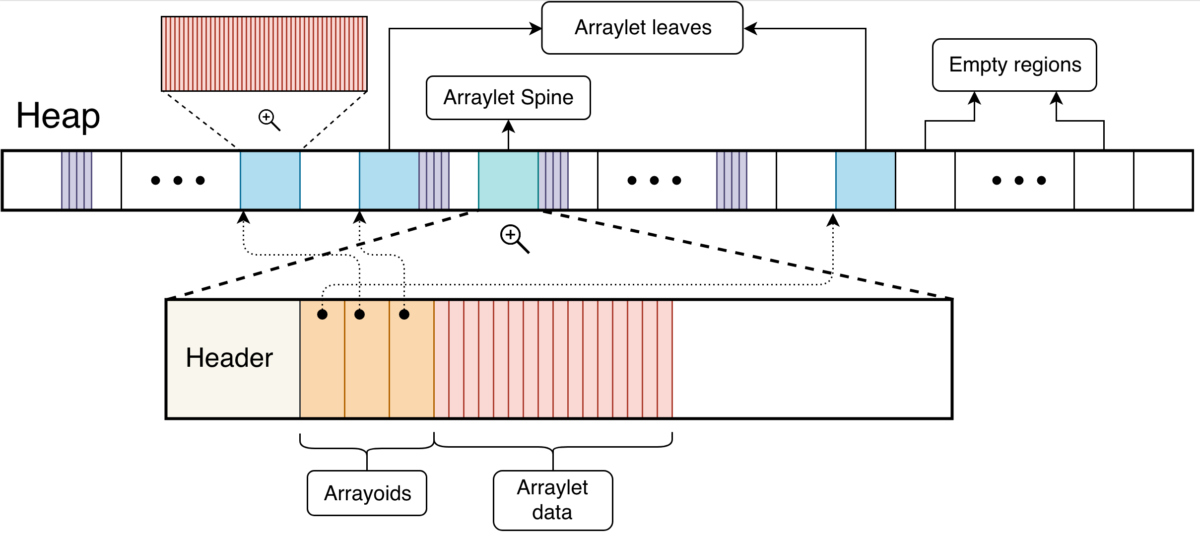
When an array or any object is created in a Java program, one of the places the Garbage Collector (GC) store objects is the heap. Individual objects are stored in a contiguous block of memory, which makes it easier to reference them. Arrays as such are also stored in a contiguous region of memory, where in theory we can access each element of the array given the starting address of the array in memory. However, that’s not the case for GC policies such as metronome and balanced [1][2]. Both these policies are region based, meaning the heap associated with the running program is divided into regions. Objects are allocated inside these regions. Array objects that are smaller than a region will be allocated contiguously, which is the default allocation layout. On the other hand, if the size of an array object surpasses the size of a region, the array is allocated in multiple regions (most likely not adjacent ones), represented as an arraylet (internally contiguous arrays are still stored as arraylets). Arraylets have a spine, which contains the class pointer and size, and leaves which contain the data associated with the array. The spine also contains arrayoids which are pointers to the respective arraylet leaves. Figure 1 explains this layout.

Figure 1: Arraylet Representation (not to scale)
Furthermore, arraylets themselves have different layouts depending on data size. They are contiguous, discontinuous and hybrid. The first layout, represented by the next figure, happens when an array size is sufficiently small to fit in a region. Note that in metronome and balanced policies all arrays are stored as arraylets, even those that fit in its entirety in a region. In this case there are no arrayoids or arraylet leaves, only the header and array data. Figure 2 illustrates two arraylets where both have a contiguous layout.

Figure 2: Arraylet Contiguous Layout
Discontiguous layout depicted in the next figure, happens when all data from the array are stored at the arraylet leaves and no data is stored alongside the spine. Figure 3 illustrates two arraylets where both have a discontinuous layout.

Figure 3: Arraylet Discontiguous Layout
Lastly, hybrid arraylets are a mixture of both contiguous and discontiguous layout, where data is stored both at the leaves as well as in the spine after the arrayoids. Figure 4 illustrates two arraylets where both have an hybrid layout.
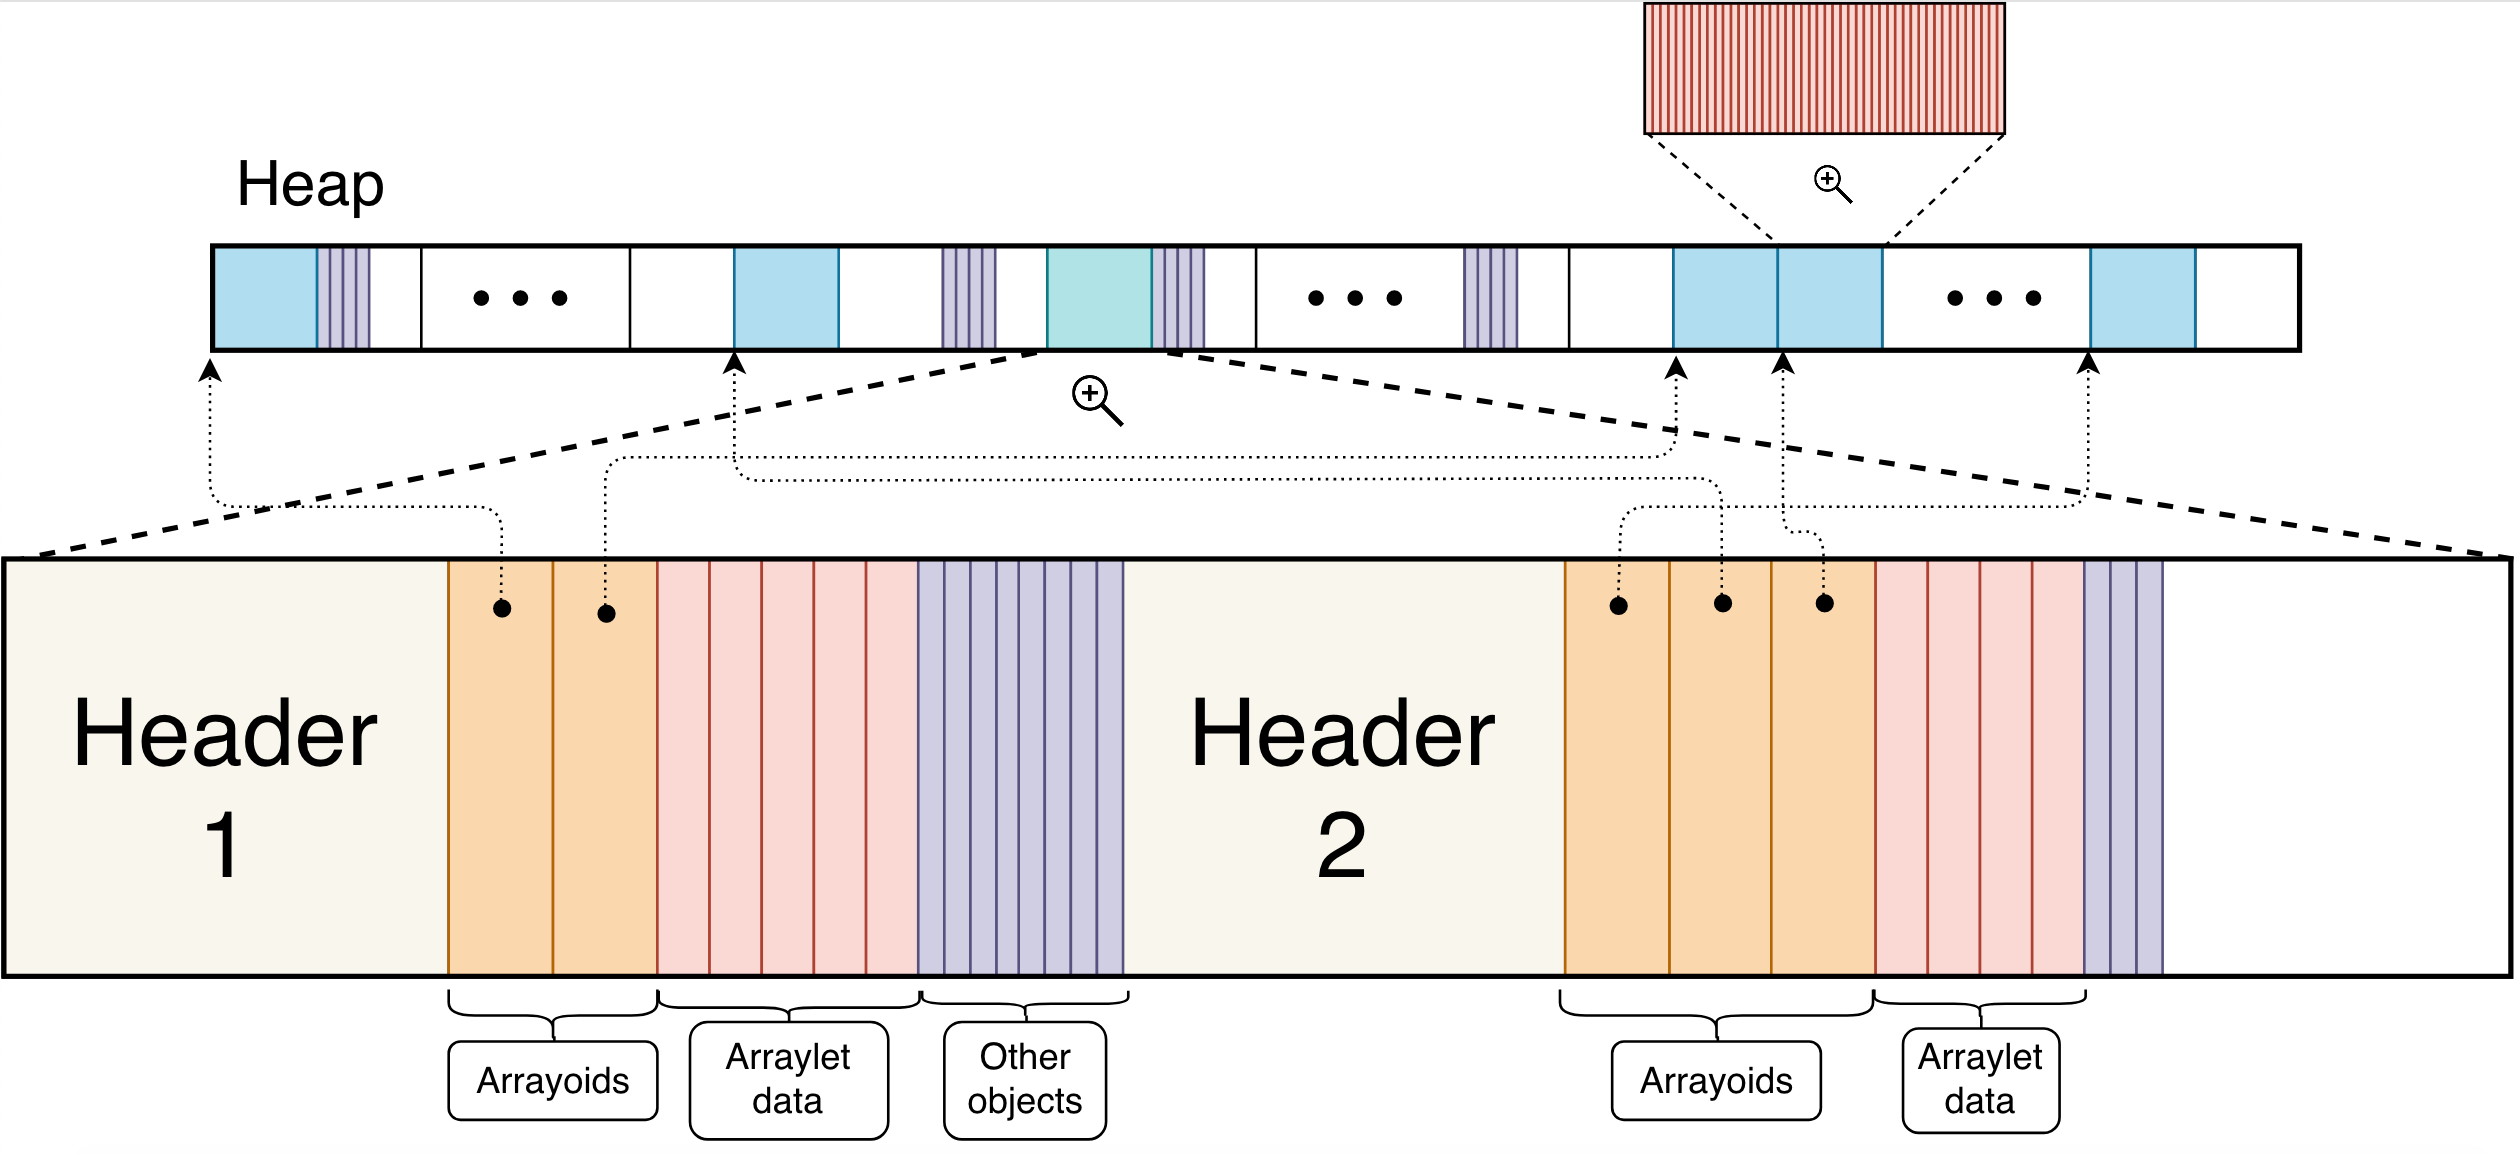
Figure 4: Arraylet Hybrid Layout
Note that in all these representations, all arraylet leaves are 100% full of array data. That will change once we introduce double mapping.
Double Mapping
The above representation of arraylets gives the GC flexibility to allocate regions not necessarily adjacent to each other. In this case, to access data in the array, we use arraylet leaf iterators, which hide the complexity of arraylet data access implementation.
Arraylets were introduced so that arrays were more cleverly stored in the heap for balanced and metronome GC policies. However, there are a few drawbacks when using them. One of those is when Java Native Interface (JNI) [3] is used. In short, JNI allows Java programs to call native code (e.g. C, C++) giving more flexibility to the program and functions that it can use. When both large arrays and JNI critical [4] are used, Java programs are experiencing a slowdown.
JNI critical is used when the programmer wants direct addressability of the object. To do that, JNI needs the object to be in a contiguous region of memory, or at least make it think the object is in a contiguous region. For that to happen, JNI critical creates a temporary array on the size of total elements in the original array. It then copies element by element to this temporary array. After the JNI critical is done it copies everything back, again element by element from the temporary array to the arraylet. Yes, that does sound expensive and it is. One use case, SPECjbb2015 benchmark [5] is not being able to finish RT curve building phase when using balanced and the GC policy. This has also become a problem for the JIT (Just in time Compile) when it performs array copy optimizations.
Double mapping arraylets was introduced to solve these problems. The initial idea was to make a large array, which is divided across the heap in different chunks, look like a contiguous array. And that was what we did, but how does it actually work?
For double mapping to happen we leverage something called Operating System Virtualization or virtual memory [7][8]. In a high level, the operating system uses virtual memory to abstract storage in a program. It hides memory fragmentation, where program variables are stored and among other things. Virtual memory also makes the program think it has more physical memory than there actually is available.
Virtual memory address space on 64-bit systems is very large, 64 bits worth in fact, compared to 32 bits in the 32-bit systems counterpart. However, physical memory is limited to a size much smaller in most cases. Using more virtual memory address space does not really cost the application anything, but using more physical memory would. Therefore, instead of using more physical memory and perform expensive copies, we map two different virtual memory addresses to the same physical memory address. Think of it as a mirror of the original arraylet, where any modification to the newly mapped address will reflect the original array data. The following figure depicts this architecture. Figure 5 captures the main advantage of double mapping explained earlier; we show original data as red rectangles and data being modified as green rectangles. Whenever an element is modified in the contiguous region of memory (green), that is reflected on the physical memory (not shown) which is then reflected in the arraylet leaves that are stored in the heap; hence, no need to copy data over.
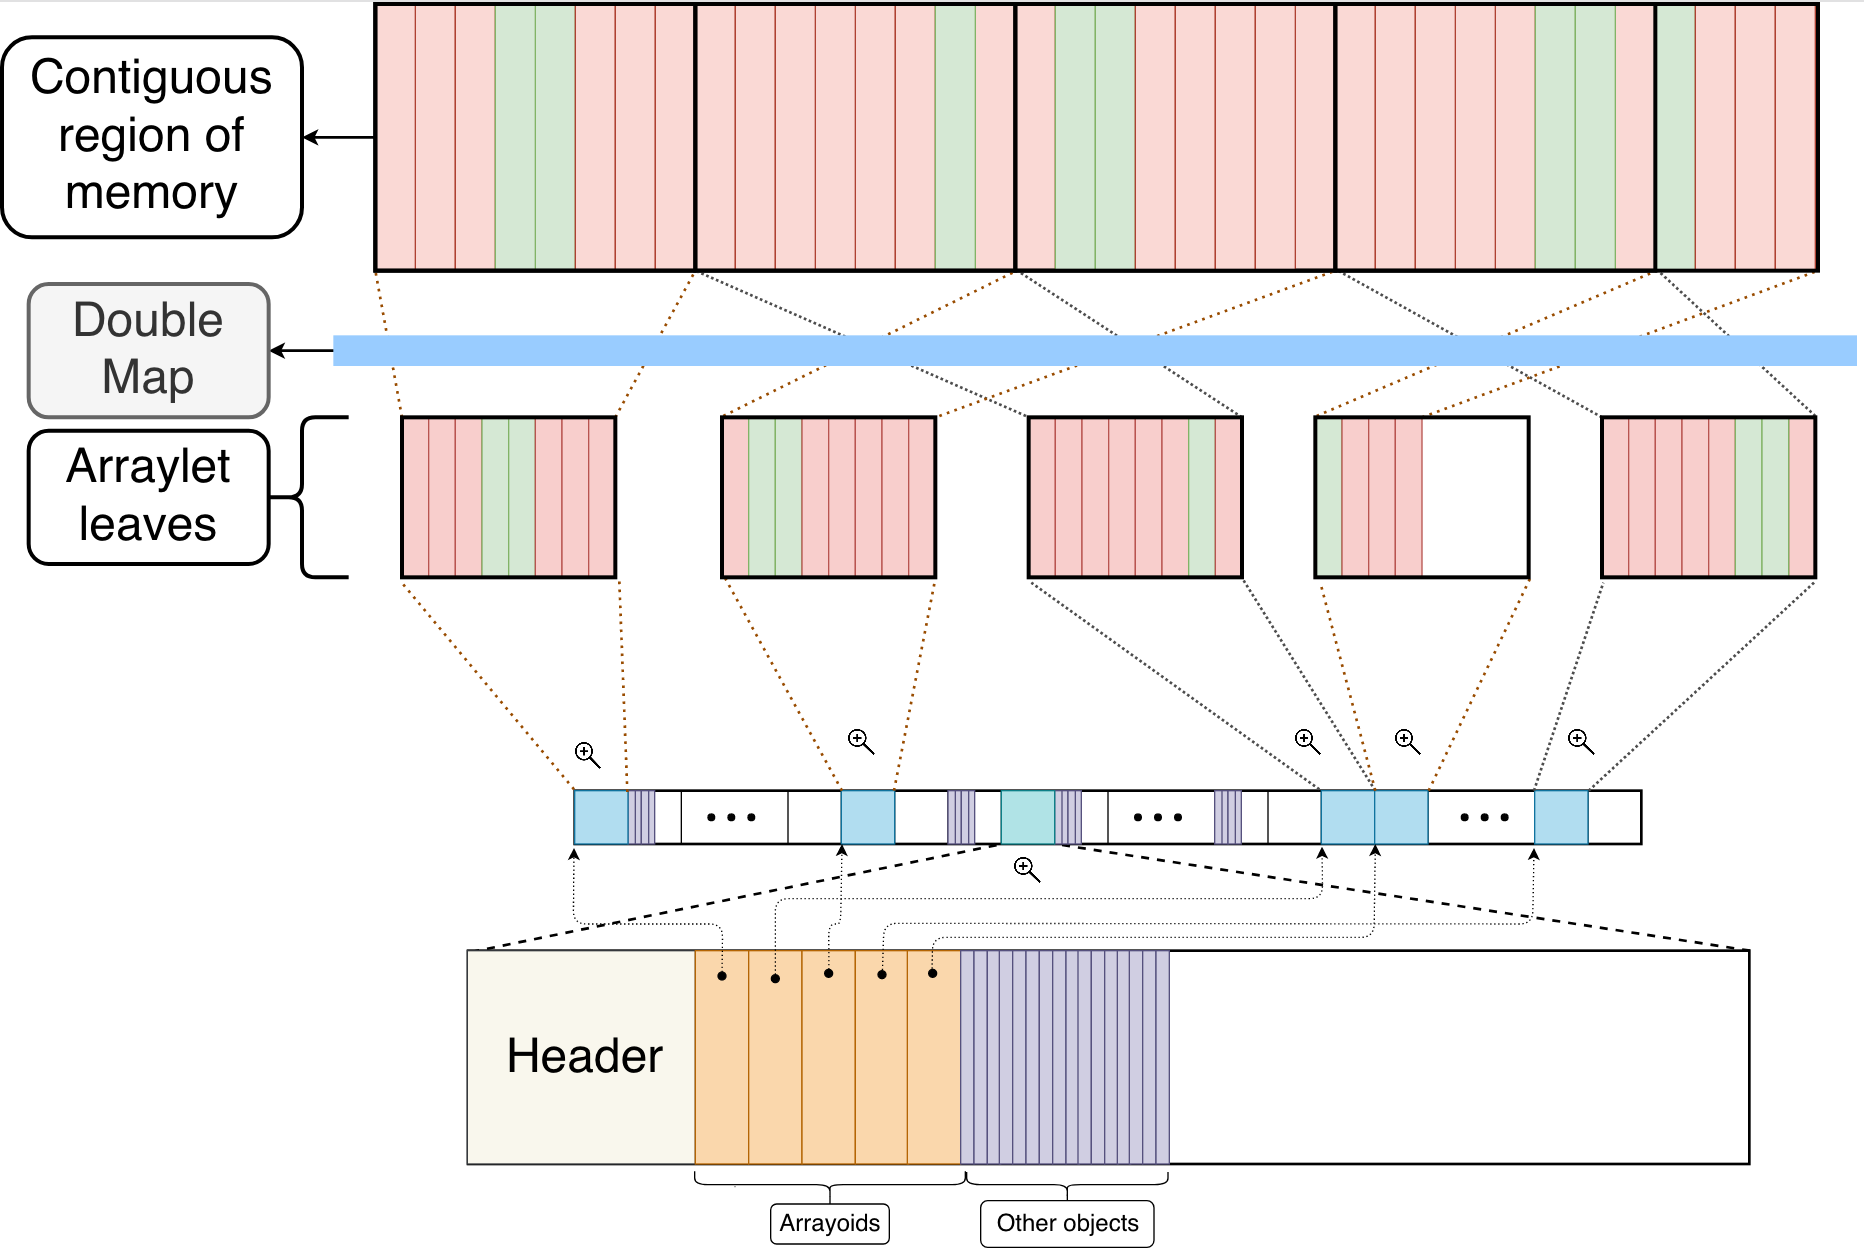
Figure 5: Double Mapping Example
With this additional feature to represent arraylets, we no longer make use of the hybrid layout. Whenever the number of elements of an array is not a multiple of a region size, the remainder elements occupy an entire region (arraylet leaf) leaving the remainder space unutilized. Whereas before, every leaf of an arraylet was 100% occupied with array data. Figure 5 shows this behavior where the last araylet leaf is roughly half full. Note that only the part containing arraylet data is double mapped.
Now, whenever JNI or JIT uses arraylets, they won’t need to create and copy element by element to a temporary array. The double mapping is created as soon as the array in the Java program is instantiated. Therefore, JNI and JIT only need to reference the contiguous memory double mapped mirror of the original array. By doing so, it saves a lot of time because the contiguous view of the array which is chucked in its arraylet leaves was already created and only needs to be referenced by JNI and/or JIT.
Prior to implementation, we conducted some experiments to prove our initial concept. These results are demonstrated in the next section. After analysing the results and their effect on the existing code base, we decided to implement approach 1 for the Linux version. We explain why in “Preliminary Experiments and Results” section. Even though Windows does not support calls to mmap, we were able to implement a version for it which follows the same principles as the Linux version.
Linux Experiments
After implementing the Linux version of double map we wrote two simple Java programs to test its performance. One simple program which creates several arrays with different sizes and another program that does the same thing but using JNI critical to do so. Its source code can be found in [6].
We forcibly set the heap size to be 1 GB and the GC policy to balanced in order to analyze if Garbage Collection would suffer from collecting objects constantly. This configuration creates a heap with 2,048 regions, each 512KB in size. Also, for this test we used a double array on the size of 8,484,144, which comprises 129 arraylet leaves in total. After JNI critical, we overwhelm the GC by allocating 2,000 arraylet leaves through several arrays (occupying 2,000 regions). We then iterate over a loop 100 times, where in each iteration it allocates and deallocates 30 arraylet leaves. By the end of the loop we would have created and freed roughly 3,000 regions. We keep the 2,000 arraylet leaves alive throughout the for loop where the GC needs to constantly free regions for upcoming new arraylets.
We ran the program with and without double map and in both cases, the GC was able to collect all necessary objects. This time reported only comprises the time related to the 129 arraylet leaf array. These simple test programs showed that when double map was used, JNI critical performed its operation 26 times faster on average. To be more precise, JNI critical, without double map, took an average of 90 milliseconds to complete; on the other hand, it took 3.5 milliseconds to complete with double map enabled. The above experiments were conducted in an Ubuntu machine with 8 virtual cores, 16 GB of RAM and 2,200.0 MHz of clock speed.
Similar to Linux, we also conducted preliminary Windows experiments which yielded better results when Double Mapping was used. However, we are still on the process of enabling double mapping on Windows platform, but we are confident that they will yield similar results as the preliminary experiments.
Preliminary Experiments and Results
Preliminary experiments shown in this section were performed prior the implementation of this new feature. Two approaches were studied in order to implement such feature. Following is a brief and more technical description of the two.
Approach 1
- In order to simulate the GC heap, we used a
shm_getcall to reserve a shared memory space. After that we callftruncateto set the desired size to be allocated, say 256MB of memory. Next, we callmmapon the file descriptor returned byshm_getto reserve the memory space , in a random location (first parameter:NULL). Also for themmapheap call, we passPROT_READandPROT_WRITEprotection flags so we can write to the heap. Finally, we passMAP_SHAREDas the fourth parameter; note that we cannot useMAP_PRIVATEhere, if we do, double map fails. A better way to implement this would be to make the entire heapMAP_PRIVATE, and only share those regions where the arraylets are located. For simplicity we share the entire heap. - Next we simulated arraylets by randomly picking locations in the heap and storing numbers of size of 2 pages. So, if the size of the system page is 4KB we would store 8KB for each arraylet (we can change this size and it does not have to be a multiple of pagesize). At this point we have our representation of the heap along with the arraylets scattered across memory (heap).
- On this step we create/reserve a contiguous memory space in order to double map the arraylets. We pre calculate the total size of all arraylets to reserve such space. We used and anonymous
mmapwithPROT_READ,PROT_WRITEandMAP_PRIVATEflags (since our heap is already shared we can passMAP_PRIVATEhere). - Lastly, we make one call to
mmapfor each arraylet because one call tommapwould not work for all of them sincemmapalways allocate a contiguous block of memory. In this approach only one file descriptor is used (different from approach 2) which relates to the heap. For eachmmapcall we pass in this file descriptor which was created on step 1 as well as each arraylet offset into the heap
Approach 2
- Unlike approach 1, in order to simulate the heap we only made a call to
mmapwithout usingshm_get. In this case we did not use a file descriptor and instead of passingPROT_READandPROT_WRITEwe passedPROT_NONEto indicate that nothing can be read, written or executed in the heap. We just “reserve” a region of memory so that later we can allocate a proper region for storing data (in this case the arraylets). - To allocate the arraylets we used one file descriptor for each of them. We do so by calling
shm_getto then callftruncatewith the size of the arraylet e.g. 8KB; finally, we callmmapwith flagsPROT_READ,PROT_WRITE,MAP_SHAREDandMAP_FIXEDbecause we want to specifically put arraylets in locations (random) in the heap. With this approach only the arraylet space can be read written to, while the rest of the heap stays protected. Furthermore, if there are 500 arraylets we would require 500 file descriptors in this approach. This is a bottleneck because systems have a hard limit on how many file descriptors can be used at a time, e.g. the system we used had a 253 as a limit. - This step is exactly the same as approach 1’s step 3 where we create/reserve a contiguous block of memory to double map the arraylets from the heap.
- Lastly, unlike the previous approach where we used the arraylets offset into the heap, in this approach we use each arraylet file descriptor to
mmapinto the contiguous block of memory created in step 3. Therefore, instead of passing in the heap address tommapwe pass the contiguous block of memory address along with arraylet file descriptors. The end result is the same as before where the double mapping is successful.
Cons approach 1:
- Associate a file descriptor to the entire heap, as a result we would have to make the entire heap as a large chunk of shared memory.
Cons approach 2:
- Hard limit of number of file descriptors that can be used at a time
We decided to implement approach 1 for OMR and OpenJ9. If we decided to choose approach 2 there would be a lot of hacks to be done regarding the file descriptor count hard limit.
Source code can be found at: https://github.com/bragaigor/Arraylets
Experiments / Benchmark
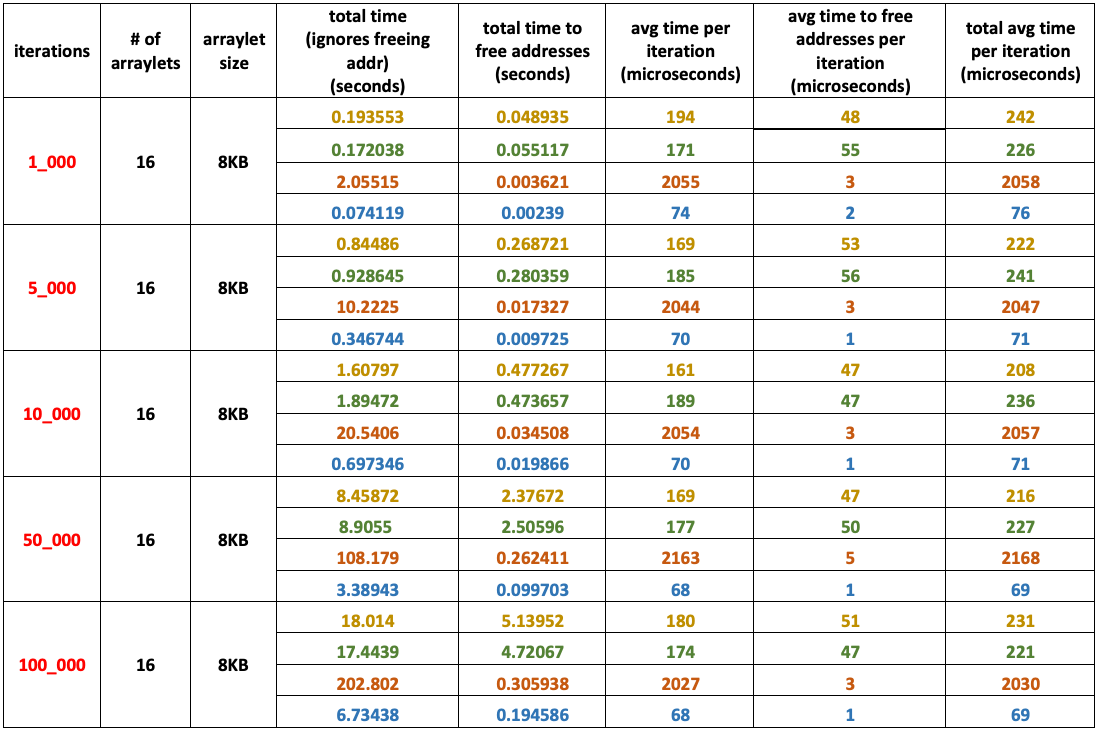
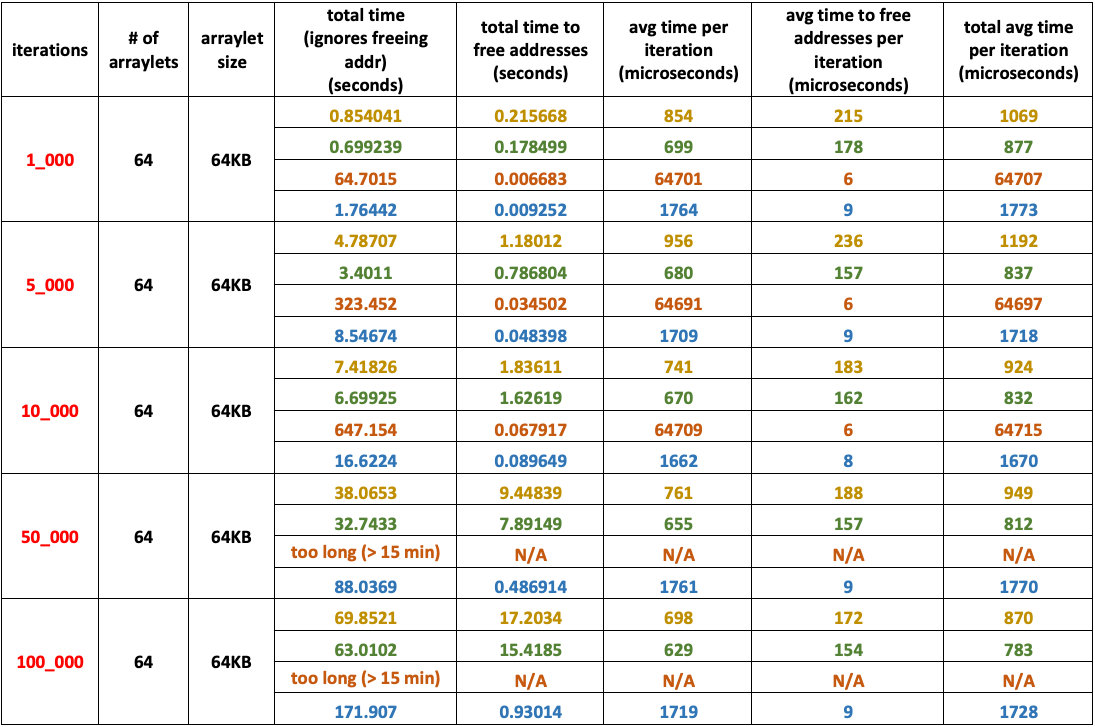
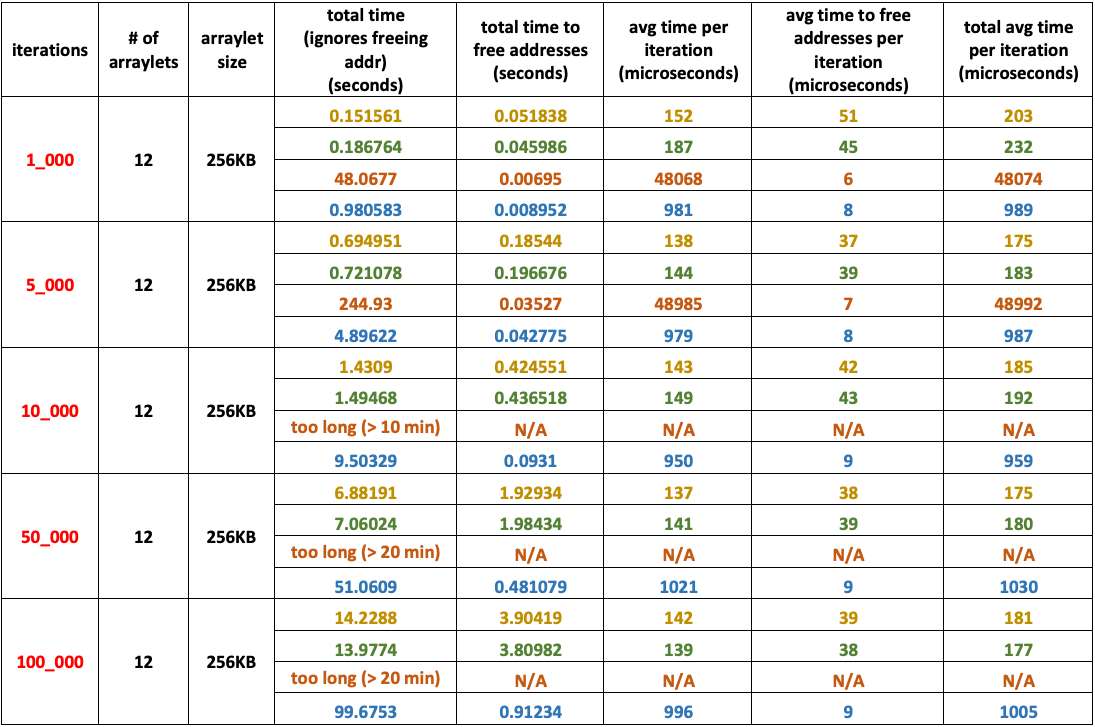
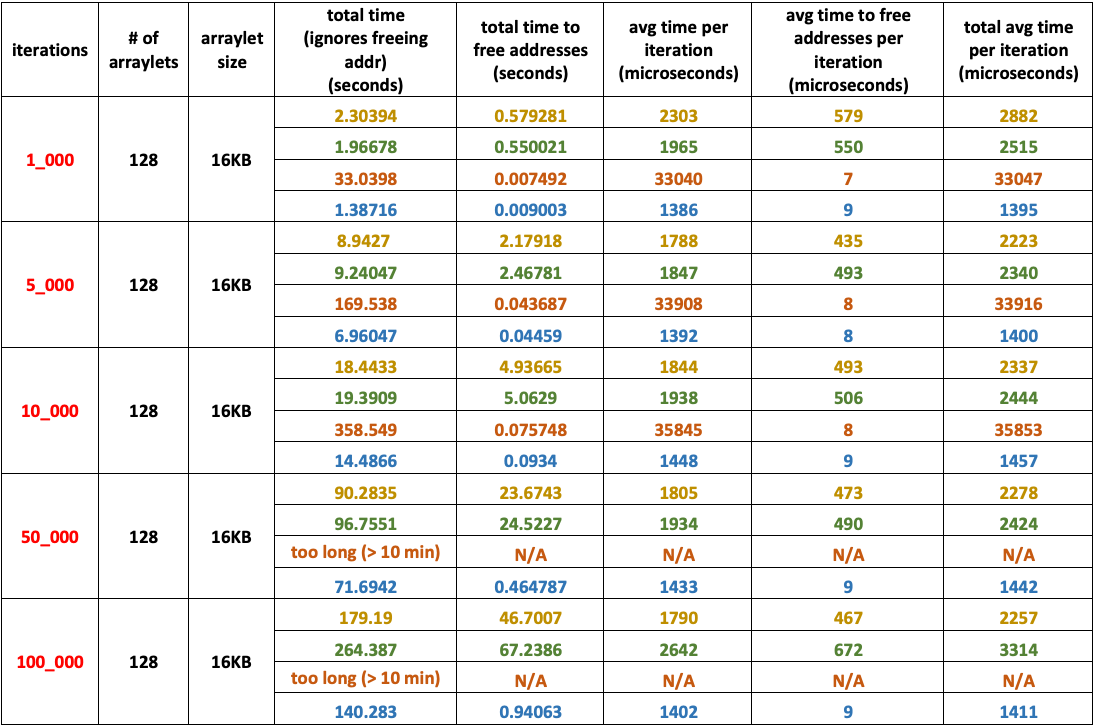
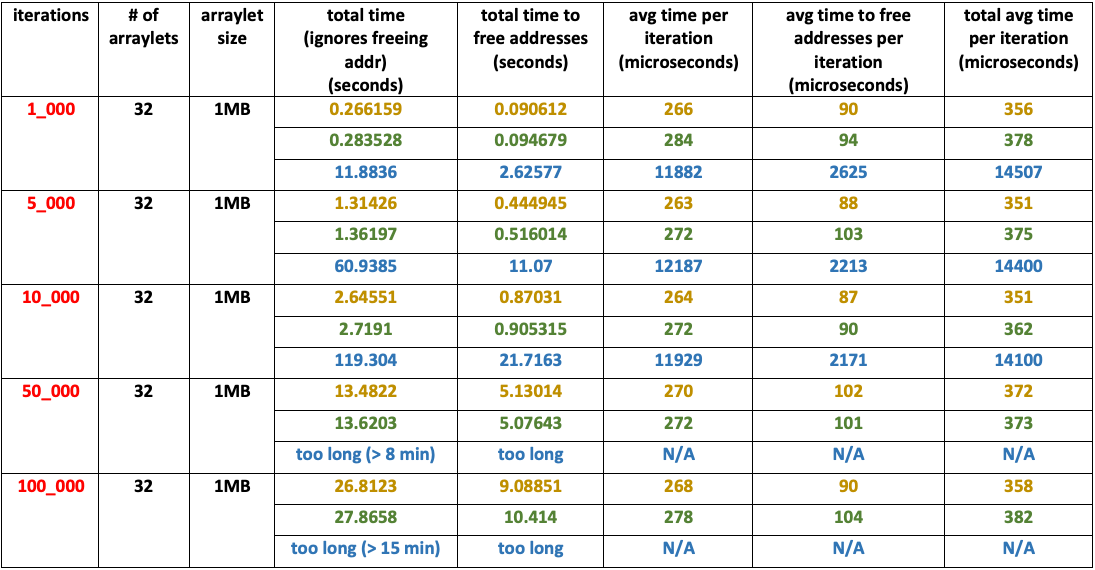
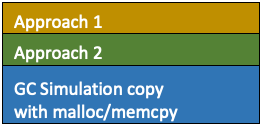
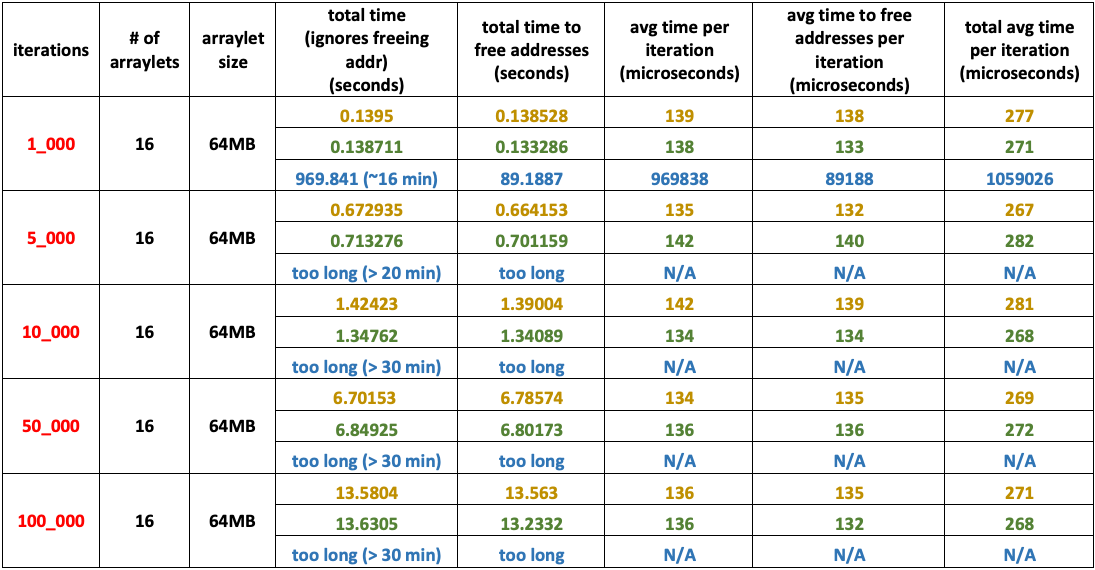
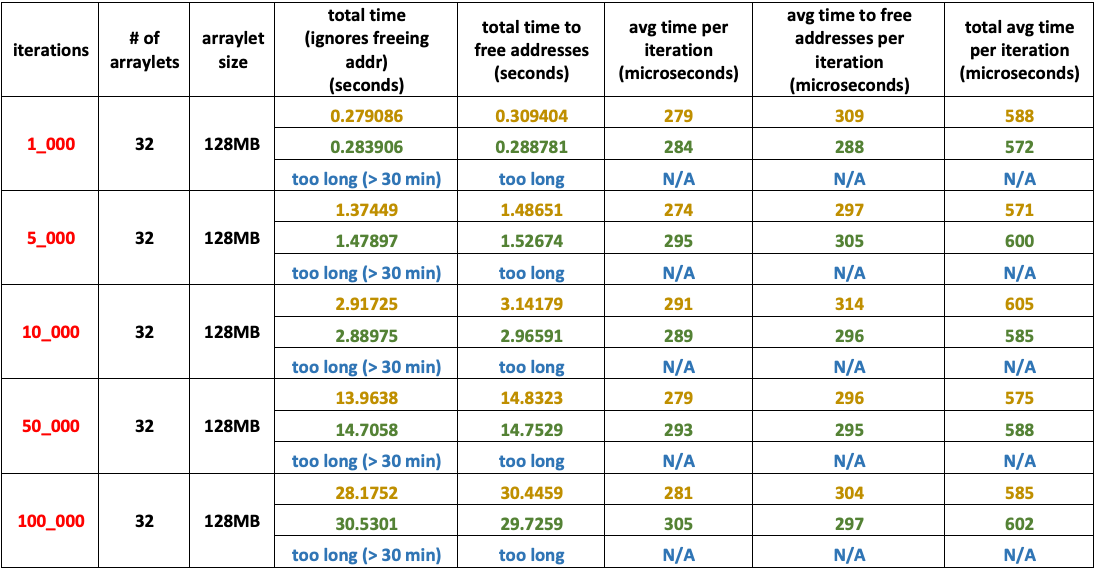
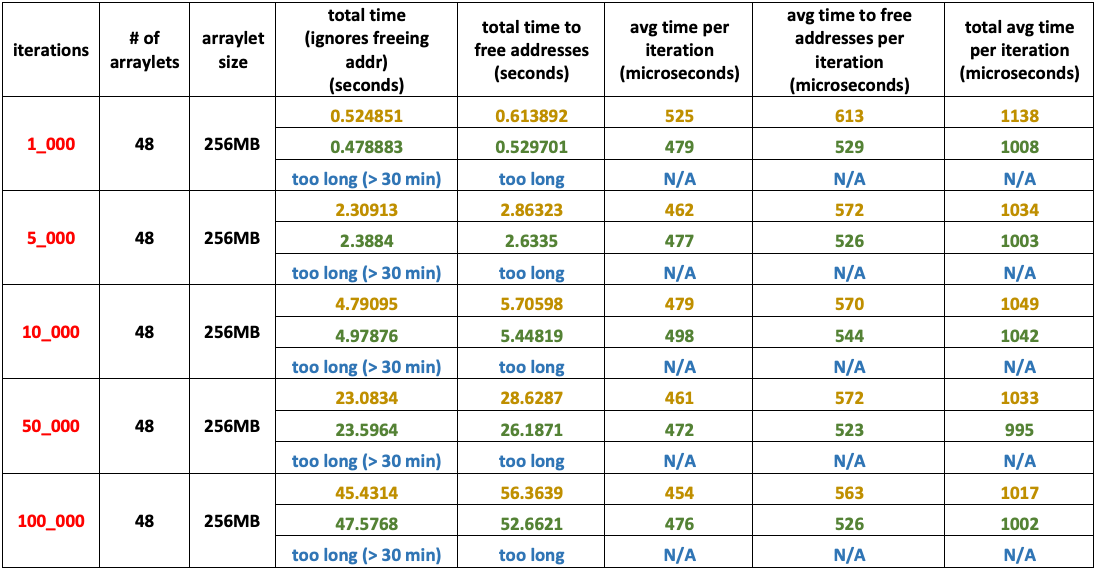
One iteration corresponds to creating/reserving contiguous block of memory, double mapping each arraylet to this chunk of memory and modifying it. The results also include the time taken to free that addresses reserved by shm_get in each iteration.
In case of GC Simulation, an iteration corresponds to copying arraylets into a separate array (index by index or through malloc followed by a memcpy call), modifying this array and then copying its contents back into the original arraylet location in the heap. For tables 1 through 4 both heap simulation does not require malloc because stack is sufficiently large to accommodate all arraylets. However, for consistency we used malloc for tests in the experiment.
Approaches 1 and 2 use munmap to free addresses allocated by shm_get/mmap while heap simulations use free to free memory allocated.
System configuration
- MacBook Pro (13-inch, Early 2015)
- Processor: 2.7 GHz Intel Core i5
- RAM: 8GB
- Graphics: Intel Iris Graphics 6100 1536 MB
- Experiments 1 through 4 use heap size of 256 MB
- Experiment 5 use heap size of 1 GB
- Experiment 6 use heap size of 4 GB
- Experiment 7 use heap size of 16 GB
- Experiment 8 use heap size of 64 GB
Experiment 1
- Low number of arraylets: – 16
- Small arraylet size: – – – – 8 KB
- Heap size: – – – – – – – – 256 MB
- Arraylets total size: – – – 128 KB
Experiment 2
- High number of arraylets: – 64
- Medium arraylet size: – – – 64 KB
- Heap size: – – – – – – – – – 256 MB
- Arraylets total size: – – – – – 4 MB
Experiment 3
- Low number of arraylets: – 12
- Large arraylet size: – – – – 256 KB
- Heap size: – – – – – – – – – 256 MB
- Arraylets total size: – – – – – 3 MB
Experiment 4
- High number of arraylets: – 128
- Small arraylet size: – – – – – 16 KB
- Heap size: – – – – – – – – – 256 MB
- Arraylets total size: – – – – – 2 MB

Experiment 5
- Medium number of arraylets: – 32
- Large arraylet size: – – – – – – – 1 MB
- Heap size: – – – – – – – – – – – – 1 GB
- Arraylets total size: – – – – – – 32 MB
Experiment 6
- Low number of arraylets: – 16
- Very Large arraylet size: – – 64 MB
- Heap size: – – – – – – – – – – – 4 GB
- Arraylets total size: – – – – – – 1 GB
Experiment 7
- Medium number of arraylets: – 32
- Very Large arraylet size: – – – 128 MB
- Heap size: – – – – – – – – – – – – 16 GB
- Arraylets total size: – – – – – – – 4 GB
Experiment 8
- Medium number of arraylets: – 48
- Very Large arraylet size: – – – 256 MB
- Heap size: – – – – – – – – – – – – 64 GB
- Arraylets total size: – – – – – – – 12 GB

Conclusion and Next Steps
On this post we introduced arraylets, explained what they are and how balanced and metronome GC policies benefit from them. Additionally, we introduced a new feature called double map that improves JNI Critical array access. Experiments showed a considerable improvement when using double map; around 26 times faster than without it to be more precise. Going forward, we will finish Windows implementation and add this feature to Mac OS and AIX as well. Lastly, we will leverage this new feature on JIT, because we believe the JIT can take advantage of double map to optimize array operations.
References
[1] OpenJ9 GC -Xgcpolicy, URL: https://www.ibm.com/support/knowledgecenter/en/SSYKE2_8.0.0/openj9/xgcpolicy/index.html
[2] Balanced Garbage Collection Policy, URL: https://www.ibm.com/support/knowledgecenter/en/SSYKE2_8.0.0/com.ibm.java.vm.80.doc/docs/mm_gc_balanced.html
[3] S. Stricker, Java programming with JNI, URL: https://www.ibm.com/developerworks/java/tutorials/j-jni/j-jni.html
[4] Copying and Pinning, URL: https://www.ibm.com/support/knowledgecenter/en/SSYKE2_7.0.0/com.ibm.java.lnx.70.doc/diag/understanding/jni_copypin.html
[5] Standard Performance Evaluation Corporation, URL: https://www.spec.org/jbb2015/
[6] Arraylet JNI Java source code, URL: https://github.com/bragaigor/ArrayletTests
[7] What are the differences between virtual memory and physical memory?, URL: https://stackoverflow.com/questions/14347206/what-are-the-differences-between-virtual-memory-and-physical-memory
[8] Virtual Memory, URL: https://www.student.cs.uwaterloo.ca/~cs350/F16/notes/vm-2up.pdf
